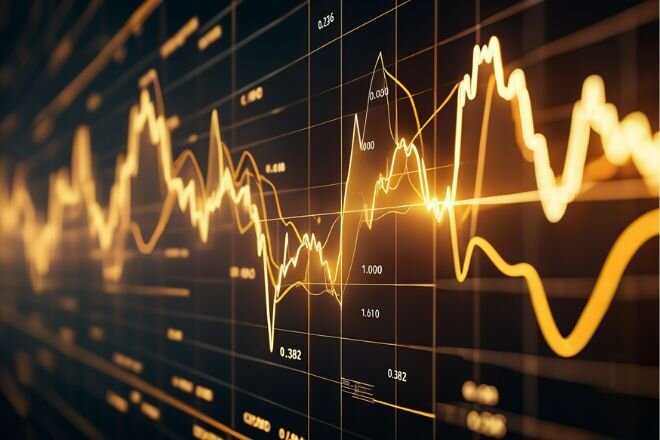
Fibonacci retracement is a cornerstone of modern technical analysis, offering traders a structured method to forecast price corrections within an ongoing trend. By applying key Fibonacci ratios to market swings, you can identify high probability zones where prices may pause, reverse, or continue their direction.
Learning how to use Fibonacci retracement effectively allows you to improve trade timing, manage risk more precisely, and gain deeper insight into market behavior. Whether you're trading forex, stocks, or crypto, this tool can become a reliable part of your strategy.
In this in depth guide, you'll discover exactly how to draw and interpret Fibonacci retracement levels step by step, understand how to combine them with other indicators, and avoid common mistakes. Keep reading to strengthen your technical skills and trade with more confidence.
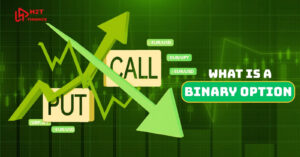
1. What is Fibonacci in Trading?
Fibonacci in trading refers to a powerful technical analysis tool based on a sequence of numbers that appear frequently in nature, mathematics, and surprisingly financial markets. Traders use Fibonacci retracements to identify potential support and resistance levels where price might pause or reverse.
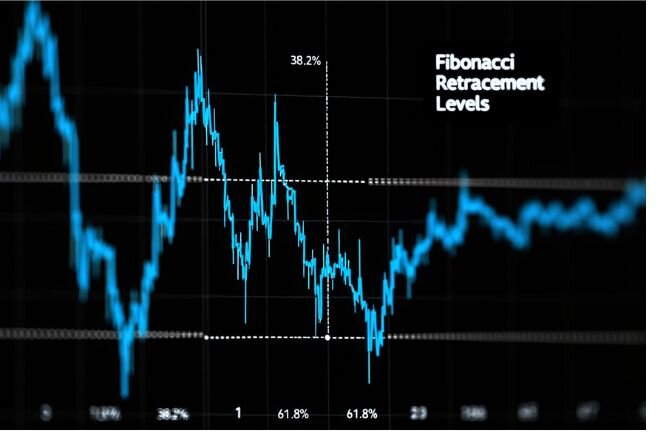
So, how to use Fibonacci retracements effectively? It starts with understanding the logic behind them. The key levels such as 38.2%, 50%, and 61.8% are drawn between a significant high and low. These levels often act like psychological magnets for price action.
If you're wondering fibonacci retracement how to use or “how to use a fibonacci retracement”, you’ll be glad to know the method is simple yet insightful. Once the tool is plotted on a chart, traders wait for price pullbacks to those retracement zones before entering trades or placing stop loss and take profit targets.
Whether you're trading forex, crypto, or stocks, Fibonacci gives you a structured way to read market behavior especially when combined with trend analysis or candlestick patterns.
2. How to use Fibonacci Retracement to uncover what the market Is Hiding
The financial markets move in rhythms that may seem random but often follow underlying patterns. Fibonacci retracement is one of the tools that helps traders uncover these hidden structures.
Fibonacci retracement in trading is more than just drawing lines on a chart. It’s a way to read market psychology, identify where the crowd might buy or take profit, and make decisions with greater confidence. When you learn how to use Fibonacci retracement, you’re not guessing you’re trading based on the market’s own logic.
Whether you're a beginner or a seasoned trader, Fibonacci retracement is a tool that adapts to your strategy. It’s simple to apply, yet powerful when combined with trends and volume analysis.
2.1 The golden ratio and its importance in price action
From the Fibonacci sequence, traders derive key ratios such as 61.8%, 38.2%, and 23.6%. The most important of these is 61.8%, also known as the Golden Ratio. This ratio shows up in everything from art and architecture to biology and, fascinatingly, in price movement patterns in markets.
These Fibonacci ratios are used to estimate where prices might pause, reverse, or continue trending. The Golden Ratio is considered a particularly strong level where institutional traders often look to enter or exit trades.
Example:
Imagine a stock surging from $100 to $150 during an uptrend. If the price starts to pull back, and you apply Fibonacci retracement from the swing low ($100) to the swing high ($150), the 61.8% retracement level would land at $119.10. If the stock bounces from this level with strong bullish volume, it can be interpreted as a buying opportunity, signaling that the uptrend might continue.
Conversely, if the price breaks below 61.8%, it could indicate that the bullish momentum is weakening, prompting caution or further confirmation before entering a trade.
Tip: Don’t rely on Fibonacci levels alone. Combine them with other tools like volume spikes, moving averages, or candlestick patterns to strengthen your trade analysis. When Fibonacci aligns with other signals, the probability of success increases.
2.2 Common Fibonacci Retracement levels
Here are the most commonly used Fibonacci retracement levels in technical analysis each with its own psychological significance:
- 23.6% – A shallow retracement, often seen in strong trends.
- 38.2% – A standard retracement level, indicating moderate correction
- 50% – Not a true Fibonacci number but widely used due to market psychology
- 61.8% – The golden zone. If the market holds here, it may strongly continue in the trend direction.
- 78.6% – A deep retracement level. If broken, it often signals a trend reversal rather than a pullback.
Example: In an uptrend, if the price pulls back to the 38.2% level and forms a bullish engulfing candle, this might be a signal to enter a long position. On the other hand, if the price breaks below the 61.8% level, it could signal weakness and a need for further confirmation before acting.
Personal Tip: I can say this don’t just blindly enter trades at Fibonacci levels. Instead, treat these zones as areas of interest, not fixed rules. Always look for confirmation from candlestick patterns, momentum shifts, or volume spikes before pulling the trigger. Fibonacci retracement isn’t a shortcut it’s a guide to understanding market rhythm. Master that rhythm, and the market starts making a lot more sense.
Learning how to use Fibonacci retracement isn’t just about drawing lines it’s about training yourself to recognize the market’s pulse.
3. Why Fibonacci Retracement Works: Psychology Meets Price Action
One of the most common questions among traders is: Why do Fibonacci retracement levels seem to work so well, even though they’re based on an ancient number sequence?
The answer lies in the intersection of trader psychology and natural patterns that repeat across financial markets.
Understanding this dynamic is essential if you want to truly master how to use Fibonacci retracement in real trading.
3.1 Trader psychology behind support and resistance
Every time you apply Fibonacci retracement to a chart, you’re not just measuring price you're measuring trader behavior.
When price pulls back to a Fibonacci level such as 38.2% or 61.8%, it often aligns with key moments of indecision or anticipation in the market. These levels act like psychological checkpoints where:
- Traders who missed the initial move are looking to enter
- Some investors are securing gains by scaling out of their positions.
- Some are reassessing their positions based on perceived value
This is why these zones frequently coincide with support or resistance: it’s not the numbers themselves, but the human response to them that gives Fibonacci its power.
3.2 Market Sentiment and Natural Patterns in Trends
Markets, like nature, move in waves. There are surges of momentum followed by periods of retracement or consolidation and Fibonacci levels offer a structured way to track that rhythm.
Here’s how sentiment aligns with Fibonacci levels:
- 23.6% retracement: Trend is very strong; market participants are eager to jump in
- 38.2% - 50% retracement: Healthy pullback; buyers/sellers are testing the waters
- 61.8% retracement: Deep retracement; uncertainty peaks, but opportunity may arise
- 78.6% retracement: Critical level; market may reverse or completely break the trend
These levels don’t just reflect technical logic they mirror the natural hesitation, fear, and optimism that fuel every price move.
3.3 Build Confidence with Fibonacci: Practice Meets Psychology
Now that you understand the psychological foundation of how to use Fibonacci retracement, it’s time to build confidence in your execution. Here’s what you can do:
Pick three trending assets (e.g. S&P 500, EUR/USD, or Bitcoin). Apply Fibonacci retracement from the latest swing low to high (or vice versa), and journal how price reacts at each key level. Are there patterns? Did the 38.2% bounce? Was the 61.8% retested?
This kind of self observation not only sharpens your skills, it strengthens your trust in the tool.
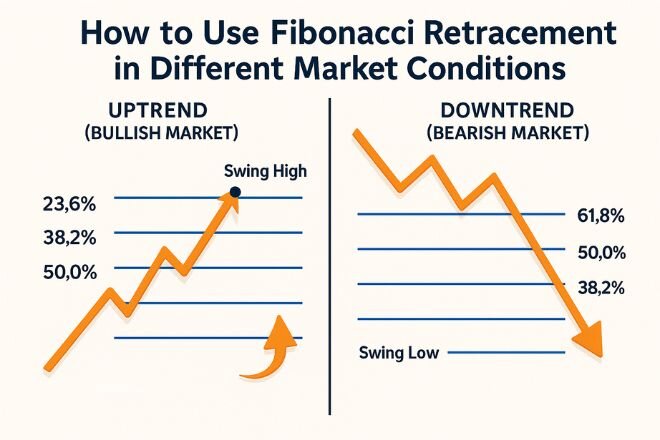
4. How to use Fibonacci Retracement in different market conditions
One of the most critical aspects of mastering how to use Fibonacci retracement is knowing how to apply it in various market conditions. Whether the market is trending up, trending down, or moving sideways, Fibonacci levels can help identify high-probability entry and exit points , if you know how to use them correctly.
4.1 Using Fibonacci in an uptrend
When markets trend upward creating a series of higher highs and higher lows traders don’t just want to chase price. They want to enter at smart levels where the risk-reward ratio is favorable. That’s where understanding how to use Fibonacci retracement becomes essential.
Here’s a detailed breakdown of how to use Fibonacci retracement in an uptrend, including best practices and psychological insights:
Step by Step: How to Use Fibonacci Retracement in a Bullish Market
Step 1: Identify the recent swing low and swing high
Start by spotting the most recent impulse move he last time the price moved significantly higher.
Example: If EUR/USD rallied from 1.0500 to 1.1000, this movement forms your base swing.
Step 2: Draw your Fibonacci retracement
Apply the Fibonacci tool from the swing low (1.0500) to the swing high (1.1000). This action will generate the key retracement levels: 23.6%, 38.2%, 50%, 61.8%, and 78.6%.
Step 3: Look for potential pullback entry zones
In an uptrend, pullbacks to the 38.2%, 50%, or 61.8% levels are common. These zones act as support, where institutional traders may be waiting to enter long positions.
Pro Insight:
“In an uptrend, the 61.8% level often acts as a springboard for price continuation. It's where fear peaks but smart money starts buying.”
— John Carter, Founder of Simpler Trading
Step 4: Confirm with confluence tools
Combine your Fibonacci retracement analysis with other indicators like RSI divergence, bullish candlestick patterns (e.g., engulfing, hammer), or a rising trendline. The more tools align at a Fibonacci level, the stronger the potential setup.
Pro Tip: Stay Patient and Plan Entries
Instead of buying into emotional momentum, wait for the price to come to your level. Set alerts around the key Fibonacci zones and only act when there’s confirmation.
If you’ve ever wondered how to use Fibonacci retracements effectively, now you have a clear, expert backed approach. Whether you’re trading Forex, stocks, or crypto, this method can be a game changer when used with discipline..
4.2 Applying Fibonacci in a Downtrend (Bearish Market)
When the market is in a bearish trend meaning it’s forming lower highs and lower lows traders often wonder: how to use Fibonacci retracement effectively to identify short selling opportunities?
The answer lies in reversing the logic used for bullish markets. Instead of buying the dip, you're selling the rally. This is a strategic move that becomes much clearer when you understand how to use Fibonacci retracements to pinpoint resistance levels where price may reverse.
Step by Step: How to Use Fibonacci Retracement in a Bearish Market
Step 1: Identify the swing high and swing low
Start by locating a clear downward price movement.
Example: If a stock declines from $120 to $100, $120 is your swing high, and $100 is your swing low.
Step 2: Apply the Fibonacci retracement tool
Use the tool by drawing from the swing high ($120) down to the swing low ($100). This is the correct orientation in a downtrend from top to bottom.
Step 3: Mark your key Fibonacci resistance levels
Now, levels like 38.2% ($107.60), 50% ($110), and 61.8% ($112.40) become critical resistance zones. These are areas where the price is likely to pause or reverse, especially when bearish sentiment is strong.
Step 4: Wait for confirmation before entering a trade
Patience is key. Once the price rallies back to a Fibonacci level, don’t jump in blindly. Look for: Bearish candlestick formations, Volume spikes or weakness. RSI bearish divergence, Moving average resistance
Once confirmed, you can enter a short position with a more informed and lower risk setup.
Tip for you: Don’t Trade Blind — Trade with Structure
Knowing how to use fibonacci retracements gives your trading structure and discipline. Always pair Fibonacci with supporting technical tools and clear confirmation signals before entering trades. This is how professionals stay one step ahead of retail traders.
4.3 Spotting Potential Reversals and Entry Points
A major strength of using Fibonacci retracement is its ability to signal reversals before they happen. Here's how to use Fibonacci retracement to detect potential entry points across any trend:
- When a price nears the 61.8% retracement, look for signs of exhaustion in the pullback (doji candles, low volume, reversal patterns).
- Pair Fibonacci levels with support/resistance zones, trendlines, or volume profile to strengthen your analysis.
- Monitor confluence when a Fibonacci level aligns with a major moving average
Understanding how to use Fibonacci retracement in different market conditions is more than theory it's a skill you develop through practice.
4.4 Fibonacci Trading Strategy: A Proven Roadmap for Precision Entries
After years of market experience, I’ve learned that how to use Fibonacci retracement goes beyond simply drawing lines it’s a disciplined, strategic method rooted in market psychology. While traders may have different styles, Fibonacci retracements consistently provide clarity in uncertain markets.
Here’s a simplified 6 step framework I’ve developed to help you use Fibonacci retracements effectively in any market condition combining technical insight with real world trading experience.
Step 1: Identify the Direction of the Trend
Before applying any Fibonacci levels, context is king. Is the market trending up, down, or moving sideways? Fibonacci retracement works best in clearly defined trends either bullish (higher highs and higher lows) or bearish (lower highs and lower lows).
Step 2: Draw Fibonacci Retracement Levels
Now it’s time to apply the Fibonacci tool. Here’s how to use a Fibonacci retracement:
- In an uptrend, draw the retracement from the swing low to the swing high.
- In a downtrend, draw from the swing high to the swing low.
The tool will generate key levels: 23.6%, 38.2%, 50%, 61.8%, and 78.6%. These levels act as zones where the price may pause, reverse, or continue..
Step 3: Look for Confluence of Signals
One of the core principles I teach when discussing how to use Fibonacci retracements is: don’t trade Fibonacci levels in isolation.
You’ll want to find areas of confluence, where Fibonacci levels intersect with: Previous support/resistance, Trendlines, Moving averages, Volume clusters, RSI or MACD divergences.
This intersection significantly increases the probability of a valid trade setup.
Pro Insight: The 61.8% Fibonacci level aligning with a rising trendline and bullish divergence on RSI is one of the most powerful long setups I’ve used.
Step 4: Confirm With Candlestick Patterns
Once the price approaches a Fibonacci level, don’t jump in immediately. Wait for the market to show its hand. This is where candlestick patterns become your filter.
Look for reversal signals such as: Bullish engulfing (in an uptrend pullback), Hammer (on support), Bearish engulfing or shooting star (in a downtrend rally).
These patterns confirm that market sentiment is shifting, giving you greater confidence to act.
Step 5: Enter the Trade and Place Your Stop-Loss
Execution is key. Once you have a clear signal:
- Enter the trade near the Fibonacci level
- Set your stop-loss just beyond the next level to allow for natural volatility
For example:
- In a long trade at 38.2%, place a stop below 50% or 61.8%
- In a short trade at 61.8%, place a stop above the 78.6% level
This protects your capital and defines your risk upfront a core component of sustainable trading.
Step 6: Monitor and Manage the Trade
Once in the trade, it’s important to track price behavior:
- Trail your stop as price moves in your favor (e.g., move it to breakeven after 1:1 risk/reward)
- Consider scaling out partial profits at key extensions (like 127.2% or 161.8%)
- Avoid overtrading let your setup play out
Remember: mastering how to use fibonacci retracement correctly requires patience, consistency, and trust in your strategy.
By following this six-step method, you’re not trading on gut feeling you’re aligning yourself with the rhythm of the market.
If you're serious about growing as a trader, this strategy gives you a roadmap. It blends structure (Fibonacci levels), psychology (candlestick confirmation), and discipline (risk management). Don’t just learn how to use fibonacci retracement train yourself to execute it with clarity.
See more useful additional articles:
- Psychological Aspects of Forex Risk Management
- Types of Currency Pairs in Forex: Understanding Major, Minor, and Exotic Pairs for Effective Trading Strategies
- How The Forex Market Works: Understanding Currency Trading Strategies And Market Dynamics
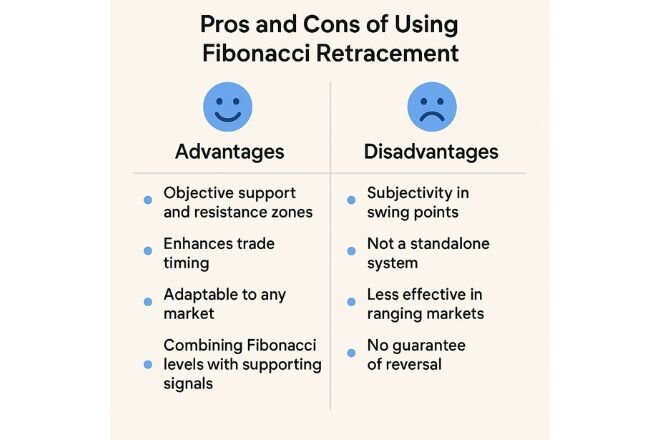
5. Pros and Cons of Using Fibonacci Retracement
While many technical traders swear by Fibonacci retracement as a core tool in their strategy, it’s important to understand that like any method, it has its advantages and limitations. Knowing both sides helps you make smarter trading decisions and avoid costly mistakes.
5.1 Benefits for Technical Traders
If you're learning how to use Fibonacci retracement, you'll quickly see why it's so popular among technical analysts. It’s not just a set of random levels it reflects natural patterns in price action and psychology, especially when used with other tools like trend lines, moving averages, or RSI.
The advantages
To get the most out of how to use Fibonacci retracement, it’s important to know its key advantages. Here's why so many traders rely on it:
- Objective Support and Resistance Zones:
Fibonacci levels (such as 38.2%, 50%, and 61.8%) often act as natural support and resistance levels. These zones can help traders anticipate where price may stall or reverse.
- Enhances Trade Timing:
Rather than chasing breakouts, you can wait for pullbacks to key retracement levels before entering a trade often improving your risk reward ratio.
- Adaptable to Any Market:
Whether you’re trading Forex, stocks, crypto, or commodities, Fibonacci retracement works across different timeframes and market types.
- Combining Fibonacci Levels with Supporting Signals:
While these benefits highlight the strengths of how to use Fibonacci retracement, it’s just as important to understand where it can fall short especially in unpredictable market conditions.
The disadvantages
Despite its strengths, knowing how to use Fibonacci retracement also means knowing its boundaries.
- Subjectivity in Swing Points:
The accuracy of Fibonacci retracement depends heavily on choosing the correct swing high and swing low. Misplacing these can lead to misleading levels.
- Not a Standalone System:
Fibonacci levels do not predict future prices they only highlight potential zones. You’ll need confirmation from other tools like RSI, MACD, or volume to build a reliable entry.
- Less Effective in Ranging Markets:
In sideways markets, price often cuts through Fibonacci levels without respecting them, making them less reliable during consolidation.
- No Guarantee of Reversal:
Just because price reaches the 61.8% level doesn’t mean it will reverse. Without other confluence signals, acting solely on Fibonacci can lead to false entries.
Learning how to use Fibonacci retracement isn't about finding a perfect formula , it's about gaining a deeper understanding of how markets move and how traders think. When used correctly, it becomes a powerful guide in your technical toolbox.
6. How to master Fibonacci?
Mastering Fibonacci retracement isn’t just about memorizing ratios like 38.2% or 61.8% — it’s about learning how to use Fibonacci retracement as part of a complete trading strategy. To truly master it, start by studying how price reacts to key levels across different timeframes.
Practice identifying swing highs and lows, and observe how the market responds at each Fibonacci zone. Then, combine your analysis with other tools like support/resistance, RSI, or candlestick patterns for confirmation.
Remember: consistency comes with repetition and review. The more charts you analyze, the more intuitive these levels become. Over time, you’ll move from asking "how to use Fibonacci retracements?" to using them confidently in real world trades.
Pro Tip: Keep a trading journal specifically for Fibonacci setups. Note what worked, what didn’t, and why. This accelerates your learning curve and builds trust in the method.
Mastering Fibonacci retracement isn't about perfectionit's about building consistent habits, trusting the process, and letting market structure guide your decisions.
7. FAQs About Fibonacci Retracement
7.1. Understanding Fibonacci Retracement: What It Is and How It Works?
Fibonacci retracement is a technical analysis tool that helps traders identify potential levels of support and resistance based on percentages derived from the Fibonacci sequence. Common retracement levels such as 38.2%, 50%, and 61.8% are used to predict how far a market might pull back before continuing in the direction of the trend. These levels are not guaranteed turning points, but they are widely respected due to recurring patterns in price action and trader psychology.
7.2. How to use Fibonacci retracement effectively in trading?
To use Fibonacci retracement effectively, traders typically identify a significant swing high and swing low on the chart, then apply the Fibonacci tool to map out key retracement levels. These levels act as potential entry points, stop-loss zones, or profit targets. For best results, combine them with other indicators such as trend lines, candlestick patterns, or volume analysis to increase confirmation.
7.3. Which Fibonacci levels are most reliable?
While all levels can offer insight, the most commonly respected ones are 38.2%, 50%, and 61.8%. The 61.8% level, known as the “golden ratio,” is particularly popular for spotting reversal zones. However, the reliability of each level depends on market conditions, timeframe, and the presence of confluence with other technical indicators.
7.4. Can Fibonacci retracement be used in all markets?
Yes, Fibonacci retracement can be used in all markets including Forex, stocks, crypto, commodities, and indices. It is also adaptable to different timeframes, making it suitable for both day traders and swing traders. That said, it's most effective in trending markets, where price movements are more structured and directional.
7.5. Does Fibonacci retracement predict the future?
No, Fibonacci retracement does not predict the future. It identifies areas where a pullback might occur based on historical price action and behavioral patterns. It’s a reactive tool, not a forecasting one. That’s why expert traders always look for confirmation before acting solely on Fibonacci levels.
7.6. Why is Fibonacci retracement so popular among traders?
Its popularity comes from its simplicity and consistency across markets. The levels are easy to apply, and when combined with other tools like support and resistance or trend analysis, they help traders make more informed decisions. Understanding how to use Fibonacci retracement effectively can give you a psychological edge and improve timing and risk management.
7.7. What are the limitations of Fibonacci retracement?
Fibonacci retracement isn’t a guaranteed predictor of price action.. One major limitation is its subjectivity different traders may choose different swing highs/lows, resulting in different retracement levels. Additionally, in sideways or choppy markets, price often ignores Fibonacci levels entirely. That’s why this tool should never be used in isolation.
7.8. When should you avoid using Fibonacci retracement?
Fibonacci retracement may not be effective during sideways markets or periods of low volatility where price lacks a clear direction. In such cases, retracement levels can become noise rather than reliable signals. It's also wise to avoid relying solely on Fibonacci without confirmation from volume, trend indicators, or candlestick patterns.
7.9. What is the Fibonacci Golden Rule?
The Fibonacci Golden Rule refers to the 61.8% retracement level often called the “golden zone.” This level is where price frequently finds support or resistance. Traders often say: “If the 61.8% level holds, the trend is likely to continue." Knowing how to use Fibonacci retracement correctly means respecting this level as a major decision point for institutional players.
7. 10.What is the best time frame to use Fibonacci retracement?
The best time frame to use Fibonacci retracement depends on your trading style. For swing traders, the 4-hour or daily chart often works best, allowing you to capture broader moves. Day traders may prefer the 15 minute to 1 hour charts for quick setups. Regardless of the timeframe, consistency is key. Always apply Fibonacci retracement on the dominant trend to avoid misleading signals.
8. Final Thoughts: Should You Use Fibonacci Retracements in 2025?
In trending markets, Fibonacci retracement continues to be one of the most effective tools for identifying potential support and resistance levels, timing entries, and setting risk-aware exits. Whether you’re analyzing a bullish rally or spotting potential reversals in a downtrend, knowing how to use Fibonacci retracement can significantly sharpen your decision-making process.
It works best when price movements are clean, directional, and follow natural patterns conditions often found in major Forex pairs and leading crypto assets. For swing traders and intraday strategists alike, Fibonacci retracement provides structure to what often feels like market chaos.
Despite its benefits, Fibonacci retracement should not be used in isolation. Its true power shines when combined with: Trendlines, Moving averages, Candlestick patterns, Volume spikes, Psychological price levels.
This layered approach enhances your trade confirmation and minimizes false signals, especially in volatile or ranging markets. It's a classic case of confluence equals confidence.
If you're looking to improve your technical trading edge in 2025, mastering how to use Fibonacci retracement is not optional it’s essential. This timeless technique offers a practical, repeatable method to navigate price action with logic rather than emotion.
Whether you're just starting out or refining your strategy, the tools and insights covered in this guide will help you make more confident decisions. This article is part of Forex Basics, a foundational content series from H2T Finance your trusted resource for practical trading education backed by real market experience.