Are you asking yourself, "What is a pennant and how to identify this formation on your trading charts?" The pennant pattern is a crucial trend continuation signal that every trader, particularly those new to the markets, should aim to master. A clear understanding of pennants will equip you with an additional valuable tool for analyzing price fluctuations in the Forex, stock, or cryptocurrency markets. Let H2T Finance guide you through the details in this comprehensive article!
1. What exactly is a pennant in technical analysis?
In the realm of technical analysis, a common question among developing traders is, what is a pennant? A pennant is a specific type of chart pattern observed on price charts that signals a temporary pause in the prevailing market trend. Fundamentally, it is classified as a continuation pattern. This means that its appearance typically suggests the original trend is likely to resume after a brief period of consolidation.
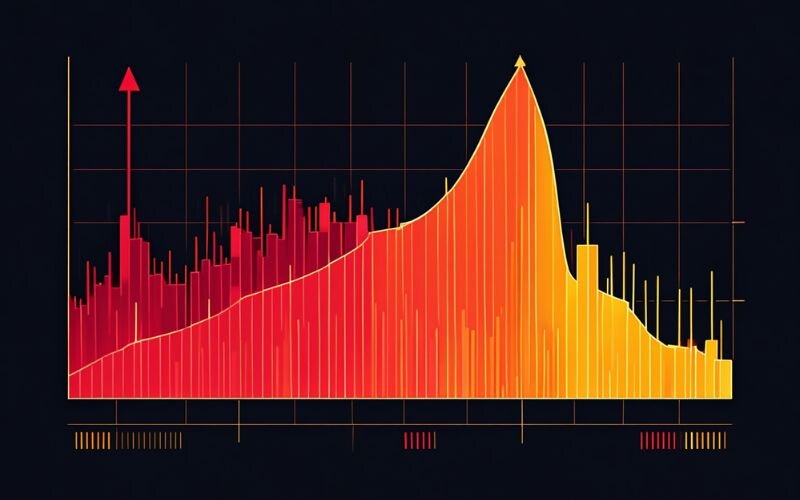
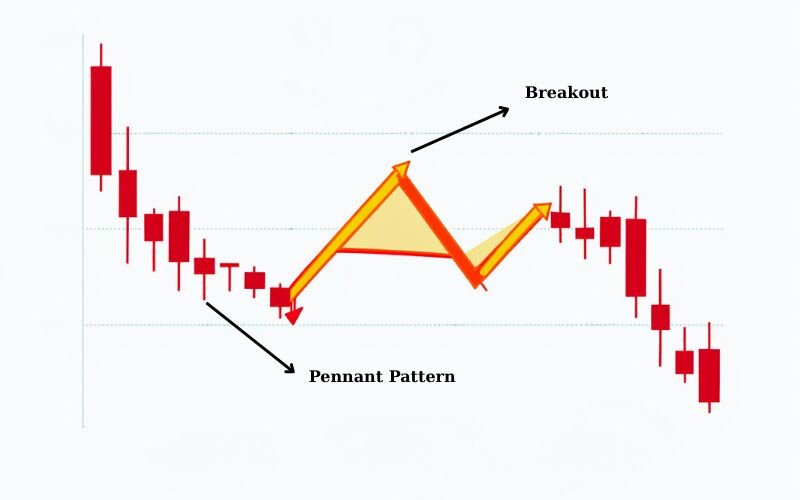
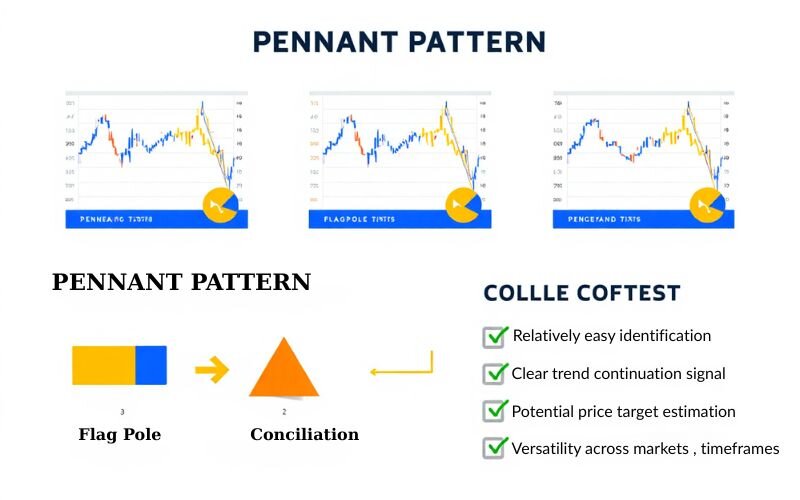
Pennants most often form after a significant and swift price movement, either upwards or downwards. This initial sharp move is commonly referred to as the "flagpole." The pennant itself then represents a short phase where the market effectively takes a breather, consolidating its strength and gathering momentum before potentially continuing in the direction established by the flagpole. Understanding this pattern can provide traders with insights into potential future price action.
2. Key characteristics: How to identify a pennant pattern accurately
Accurately identifying a pennant pattern hinges on recognizing its distinct components. Each characteristic plays a role in confirming the pattern and its potential implications for future price movement. Understanding how to identify a pennant pattern correctly is crucial for traders looking to utilize it in their analysis.
2.1. The flagpole (pennant flagpole)
The first essential component is the flagpole. This represents a sharp, near-vertical price movement that occurs immediately before the pennant formation begins. The flagpole can be either bullish (a strong upward surge) or bearish (a steep downward plunge). Its significance lies in demonstrating the initial, powerful momentum of either buyers or sellers, setting the stage for the subsequent consolidation.
2.2. The pennant itself: A period of consolidation (Pennant Consolidation)
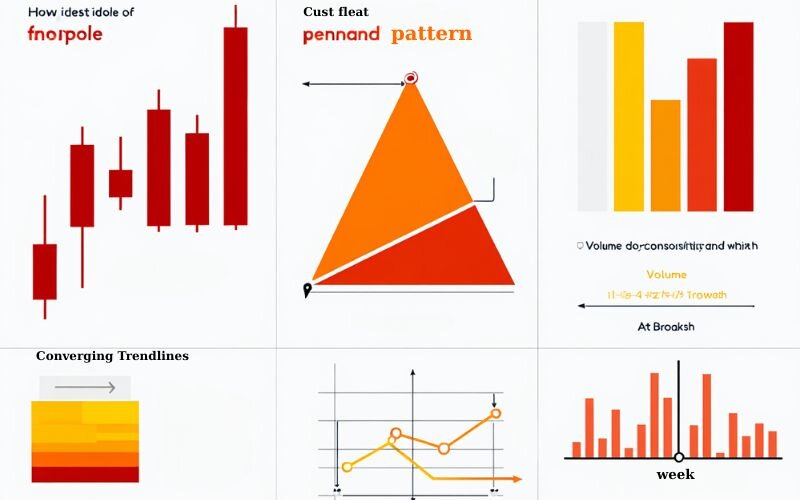
Following the flagpole, the pennant itself forms. This is characterized by a period of price consolidation where trading activity narrows. The pennant formation takes shape as two converging trendlines, creating a small triangular shape. This phase indicates that the market is temporarily pausing, with buying and selling pressures reaching a short-term equilibrium before the next potential move.
2.3. Converging Trendlines
The visual hallmark of the pennant is its converging trendlines. An upper trendline, acting as resistance, slopes downwards, while a lower trendline, acting as support, slopes upwards. These lines meet at an apex, forming a small, symmetrical triangle. It's important to distinguish a pennant from a standard symmetrical triangle primarily by the presence of a preceding flagpole and generally, a shorter formation period for the pennant.
2.4. Volume pattern: A crucial Confirmation Signal
Trading volume provides a critical confirmation signal when identifying pennants. Typically, during the formation of the flagpole, volume is noticeably high, reflecting the strong conviction behind the initial move. As the pennant (the consolidation phase) develops, volume tends to diminish significantly. Then, upon a valid price breakout from the pennant, a sharp increase in volume is expected. This surge in volume helps confirm the strength and validity of the breakout. A breakout on low volume is often less reliable.
2.5. Typical duration
Pennants are generally considered short-term continuation patterns. Their formation typically spans from a few trading days up to about three weeks. If the consolidation period extends much beyond this timeframe, the pattern might be evolving into a different chart formation, such as a symmetrical triangle, and its interpretive value as a pennant diminishes.
3. Types of pennant patterns: Bullish vs. bearish
Pennant patterns are primarily categorized into two types based on the direction of the preceding trend: bullish and bearish. Recognizing which type is forming is key to anticipating the likely direction of the subsequent price movement.
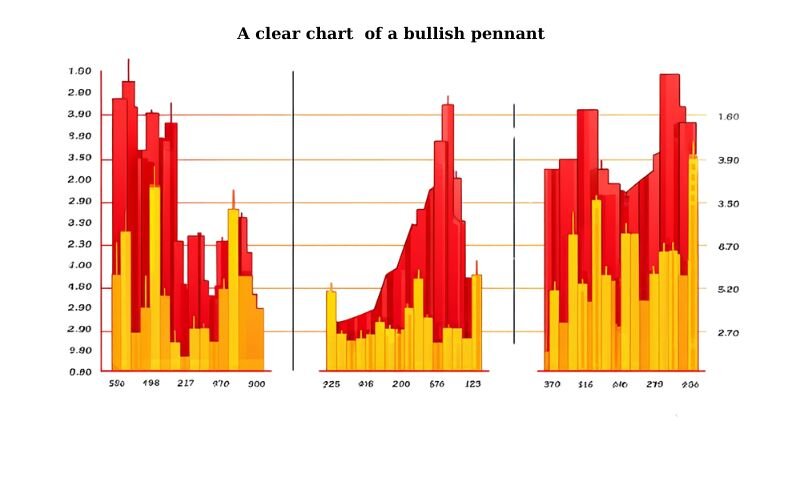
3.1. Bullish pennant
A bullish pennant forms during an established uptrend and signals a high probability that the upward price movement will continue.
Its construction begins with a strong upward price surge, which forms the flagpole. This is followed by the pennant itself – a period of consolidation where prices trade within a narrowing range defined by two converging trendlines.
The expectation for a bullish pennant is that the price will eventually break out upwards from the consolidation, resuming the prior uptrend. In this context, what does a pennant pattern indicate? It suggests a potential buying opportunity for traders anticipating further price appreciation.
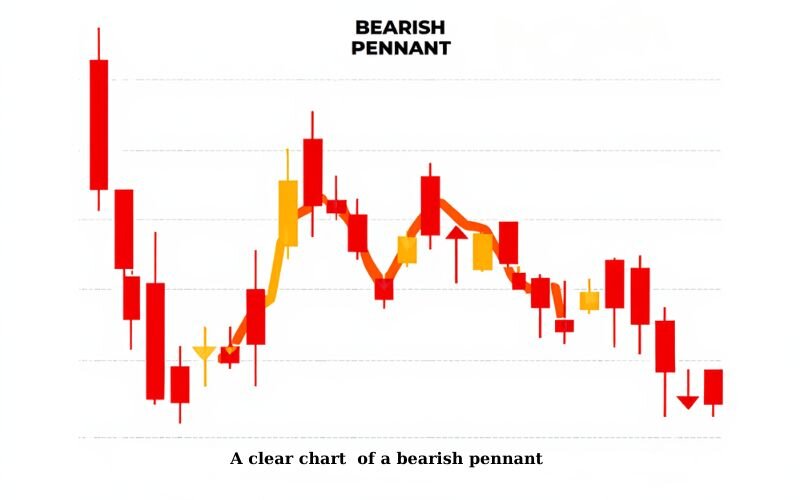
3.2. Bearish pennant
Conversely, a bearish pennant appears within a prevailing downtrend and indicates a likelihood that the downward price movement will persist. The structure starts with a sharp, significant drop in price, creating the flagpole. Following this, the pennant consolidation phase takes place, with prices moving sideways in an increasingly tight range.
For a bearish pennant, the anticipated outcome is a downward breakout from the pennant formation, leading to a continuation of the existing downtrend. What does a pennant pattern indicate in this scenario? It points to a potential selling or short-selling opportunity for traders expecting prices to fall further.
4. Interpreting pennant patterns: What do they signal?
Overall, a pennant pattern is generally interpreted as a strong signal for trend continuation. After the brief consolidation phase, the market is expected to resume its movement in the direction of the initial, powerful flagpole. However, careful interpretation, especially of the breakout, is crucial.
4.1. The significance of the breakout (pennant pattern breakout)
The breakout is the most critical moment in a pennant formation. The direction of this breakout typically aligns with the direction of the original flagpole. A bullish pennant is expected to break out to the upside, while a bearish pennant is anticipated to break out to the downside.
For a breakout to be considered valid, traders look for a clear price close outside the confines of the pennant's trendlines. Ideally, this breakout should be accompanied by a noticeable increase in trading volume, which adds conviction to the move. Being cautious of false breakouts is essential; these occur when price momentarily moves beyond a trendline but then quickly reverses back into the pattern. Waiting for a confirmed close and volume support can help mitigate this risk.
4.2. Estimating potential price targets (theoretical)
Technical analysts often use the pennant pattern to estimate potential price targets, although these are theoretical and not guaranteed. The common method involves measuring the height of the initial flagpole. This distance is measured from the start of the flagpole (the beginning of the sharp move) to the highest point of the pennant for a bullish setup, or to the lowest point of the pennant for a bearish setup.
To project a target, this measured flagpole height is then added to the breakout point for a bullish pennant, or subtracted from the breakout point for a bearish pennant. It's vital to remember that this is purely a theoretical estimation and should not be the sole basis for a trading decision. Market conditions can change, and prices may not reach these projected levels. Always combine target estimation with other analytical tools and robust risk management strategies. The basic pennant pattern rules – waiting for a confirmed breakout and observing volume confirmation – remain paramount.
See more related articles:
- What is stop limit order? The risk management secret and trading mastery tip from experts
- How does forex trading work? Learn the basics today
5. How to trade forex with a Pennant Pattern?
Pennant patterns are highly regarded continuation patterns in technical analysis, signaling that a strong prior trend is likely to resume after a brief period of consolidation. Trading pennants in the Forex market involves identifying the pattern accurately and then strategically planning your entry, stop-loss, and profit targets based on the anticipated breakout.
Here’s a step-by-step guide on how to trade Forex with a pennant pattern:
5.1. Identify the pennant pattern correctly
Before you can trade a pennant, you must confirm its key components on your Forex chart:
- The Flagpole: There must be a sharp, strong preceding move (either upward for a bullish pennant or downward for a bearish pennant). This strong move forms the "flagpole" and indicates significant momentum.
- The Pennant (Consolidation): Following the flagpole, the price action should enter a brief consolidation phase characterized by two converging trendlines. This forms a small, symmetrical triangle shape (the pennant). The trendlines should slope towards each other.
- For a bullish pennant, the flagpole is an up-move, and the pennant consolidates slightly downwards or sideways.
- For a bearish pennant, the flagpole is a down move, and the pennant consolidates slightly upwards or sideways.
- Decreasing Volume (Optional but Ideal): Typically, trading volume tends to decrease during the formation of the pennant itself. This suggests a temporary pause or indecision before the next significant move. An increase in volume on the breakout adds more conviction.
5.2. Wait for a confirmed breakout
The most crucial part of trading a pennant is waiting for a clear breakout from the consolidation phase.
- Bullish Pennant Breakout: Look for the price to decisively break and close above the upper (resistance) trendline of the pennant.
- Bearish Pennant Breakout: Look for the price to decisively break and close below the lower (support) trendline of the pennant.
- Confirmation: To avoid false breakouts (or "fakeouts"), many traders prefer to wait for a candle to close beyond the trendline rather than just an intraday spike. A surge in volume accompanying the breakout candle is a strong confirming signal.
5.3. Determine your entry strategy
Once a breakout is confirmed, you can plan your entry:
- Aggressive Entry: Enter the trade as soon as the price breaks out of the pennant (e.g., a few pips beyond the broken trendline). This ensures you don't miss the initial move but carries a higher risk of being caught in a false breakout.
- Conservative Entry (Retest): Wait for the price to break out and then potentially pull back to retest the broken trendline, which should now act as support (in a bullish breakout) or resistance (in a bearish breakout). If the retest holds and the price resumes in the breakout direction, enter the trade. This offers a potentially better risk-to-reward ratio but you might miss the trade if there's no retest.
5.4. Set your stop-loss order
Proper stop-loss placement is vital for managing risk:
- Bullish Pennant: Place your stop-loss order just below the lower trendline of the pennant, or below the recent swing low formed within the pennant prior to the breakout. Some traders place it a few pips below the breakout candle's low.
- Bearish Pennant: Place your stop-loss order just above the upper trendline of the pennant, or above the recent swing high formed within the pennant prior to the breakout. Some traders place it a few pips above the breakout candle's high.
Ensure your stop-loss gives the trade some breathing room but limits your potential loss to an acceptable level based on your risk management rules.
5.5. Establish your profit target(s)
There are a couple of common methods to project potential profit targets for pennant patterns:
- Flagpole Measurement Method: This is the classic approach. Measure the vertical height of the flagpole (the initial strong move leading into the pennant). Then, project this same distance from the breakout point in the direction of the breakout.
- Example: If the flagpole of a bullish pennant on EUR/USD was 100 pips high, and the breakout from the pennant occurred at 1.0850, your initial profit target would be around 1.0950 (1.0850 + 100 pips).
- Risk/Reward Ratio: Use a predefined risk/reward ratio. For example, if your stop-loss is 30 pips away, you might aim for a profit target that is 60 pips (1:2 ratio) or 90 pips (1:3 ratio) away.
- Previous Support/Resistance Levels: Identify significant historical support or resistance levels on the chart that might act as profit-taking zones.
Example Scenario: Trading a Bullish Pennant on USD/JPY
- Identification: USD/JPY makes a sharp 80-pip rally (the flagpole). It then consolidates for several candles, forming converging trendlines with decreasing volume.
- Confirmation: A candle closes decisively above the upper trendline of the pennant, accompanied by an increase in volume.
- Entry: You decide to enter a buy order a few pips above the breakout candle's high.
- Stop-Loss: You place your stop-loss a few pips below the lower trendline of the pennant.
- Profit Target: You measure the flagpole (80 pips) and project it from your entry point, setting a profit target 80 pips higher.
Important considerations when trading pennants in Forex:
- Context of the Broader Market: Always consider the overall market trend. Pennants are more reliable when they form in the direction of a well-established, longer-term trend.
- Currency Pair Volatility: Different currency pairs have varying levels of volatility, which can affect the size of flagpoles and the speed of breakouts.
- Timeframe: Pennants can appear on any timeframe, from short-term (e.g., 15-minute charts) to long-term (e.g., daily charts). The reliability might be higher on longer timeframes, but trading opportunities will be less frequent.
- Economic News Releases: Be cautious of trading pennants just before major economic news releases, as high volatility can invalidate patterns or cause extreme slippage.
- Risk Management: Pennant patterns are not foolproof. Always use appropriate risk management techniques, such as risking only a small percentage of your trading capital (e.g., 1-2%) on any single trade.
By understanding these steps and considerations, Forex traders can effectively incorporate pennant patterns into their technical trading strategies. Remember that consistent practice on a demo account can help you become proficient in identifying and trading these formations.
6. Pennant vs. other similar chart patterns: Key distinctions
For traders, especially those newer to technical analysis, it's common to encounter chart patterns that appear similar in shape. Distinguishing a pennant from formations like flags, wedges, and triangles is vital for accurate interpretation and effective trading decisions. Understanding these key differences can help avoid misinterpreting market signals.
Here's a brief overview comparing these patterns:
| Pattern Name | Flagpole | Shape of Consolidation | Typical Formation Time | Main Significance |
| Pennant | Yes (Sharp move) | Small, converging trendlines | Short (1-3 weeks) | Continuation |
| Flag | Yes (Sharp move) | Parallel trendlines (channel-like) | Short (1-3 weeks) | Continuation |
| Wedge | Not always present | Converging trendlines (often larger) | Medium to Long | Continuation/Reversal |
| Triangle | Not always present | Converging trendlines (can vary) | Medium to Long | Continuation/Ambiguous |
Let's delve deeper into these distinctions.
6.1. Pennant vs. flag pattern
Both pennants and flags are well-known continuation patterns that are preceded by a significant price movement known as a flagpole. This shared characteristic is often a source of initial confusion.
The primary difference lies in the shape of the consolidation phase that follows the flagpole.
- A pennant is characterized by two converging trendlines, forming a small triangle.
- A flag, on the other hand, is defined by two parallel trendlines, creating a rectangular or small channel shape. This channel typically slopes slightly against the direction of the flagpole.
Additionally, the formation period for a pennant is often slightly shorter than that of a flag, though both are considered short-term patterns.
[Image suggestion: A side-by-side comparison chart showing a pennant next to a flag, clearly highlighting the different shapes of their consolidation phases.]
6.2. Pennant vs. wedge pattern (difference between pennant and wedge)
Pennants and wedges both feature converging trendlines, which can make them appear similar at first glance. However, there are crucial differences.
Key distinctions include:
- Flagpole: A pennant always has a distinct flagpole (a sharp, preceding price move). Wedges, while sometimes forming after a strong move, do not necessarily require a flagpole as a defining characteristic.
- Formation time and size: Wedges are typically larger patterns that take a longer time to develop compared to the short-term nature of pennants.
- Significance: Pennants are predominantly continuation patterns. Wedges, however, can be either continuation or reversal patterns. For example, a rising wedge forming within an uptrend can signal a potential bearish reversal, while a falling wedge in a downtrend might indicate a bullish reversal. This dual nature makes the interpretation of wedges more context-dependent.
[Image suggestion: A side-by-side comparison chart showing a pennant next to a wedge, emphasizing the presence/absence of a flagpole and the potential difference in size/duration.]
6.3. Pennant vs. triangle pattern
While a pennant itself forms a small triangle, it's important to distinguish it from broader triangle patterns like symmetrical, ascending, or descending triangles. The key distinction is that a pennant is essentially a very specific type of small, short-term triangle that must be preceded by a flagpole.
Broader triangle patterns can form over longer periods, may or may not have a flagpole, and their breakout implications can vary more widely. Pennants, due to the flagpole context, are more narrowly defined as short pauses before a likely trend continuation. Think of a pennant as a compact, fast-forming triangle with a clear directional bias established by its flagpole.
7. Advantages and limitations of using pennant patterns
Like any tool in technical analysis, pennant patterns offer distinct advantages but also come with inherent limitations. A balanced understanding is crucial for effectively incorporating them into a trading strategy.
7.1. Advantages
Pennant patterns are favored by many traders for several reasons:
- Relatively easy identification: Once a trader understands the core characteristics – the flagpole and the small, converging consolidation – pennants can be spotted with reasonable ease on price charts.
- Clear trend continuation signal: They generally provide a fairly straightforward indication that the prevailing trend is likely to resume after the consolidation period.
- Potential price target estimation: As discussed, the flagpole height can be used to project a theoretical price objective following a breakout, offering a potential risk-reward framework.
- Versatility across markets and timeframes: Pennant patterns can form and be utilized across various financial markets, including Forex, stocks, and cryptocurrencies, and they can appear on different chart timeframes, from intraday to daily or weekly charts.
7.2. Limitations and considerations
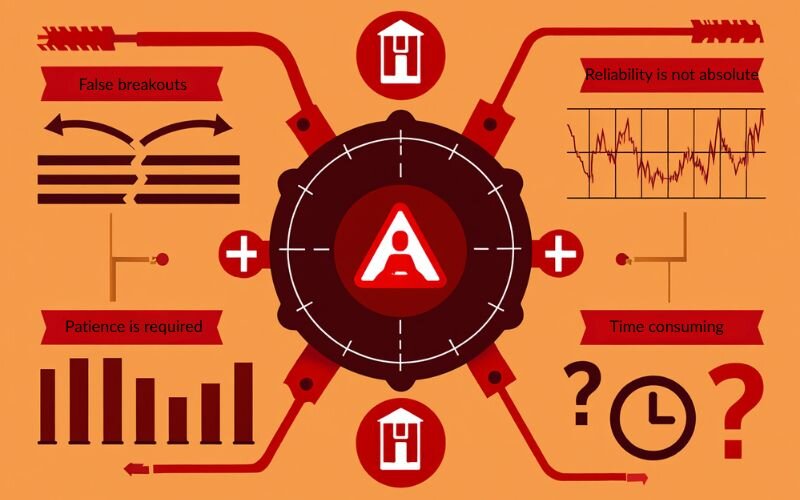
Despite their utility, it's important to be aware of the limitations and factors that can affect the pennant pattern reliability:
- Potential for false breakouts: This is a common challenge with many chart patterns. Price might briefly break out of the pennant only to reverse, trapping traders who entered prematurely. General lessons observed from market behavior indicate that patience in waiting for a confirmed close and volume support is key to mitigating this.
- Reliability is not absolute: No chart pattern, including the pennant, offers a 100% success rate. The pennant pattern reliability is influenced by broader market context, prevailing macroeconomic factors, and the strength of confirmation from other technical indicators.
- Patience is required: Successfully trading pennants often requires waiting for the pattern to fully form and for the breakout to be clearly confirmed. Entering too early during the consolidation phase can be risky.
Lessons learned from applying pennant patterns in live markets consistently highlight the importance of this confluence of signals: Should not be used in isolation. Relying solely on a pennant pattern for trading decisions is ill-advised. Effective analysis involves combining pennants with other technical tools such as moving averages, the Relative Strength Index (RSI), MACD, and overall price action analysis to build a more comprehensive market view.
8. Common mistakes to avoid when identifying and trading pennants
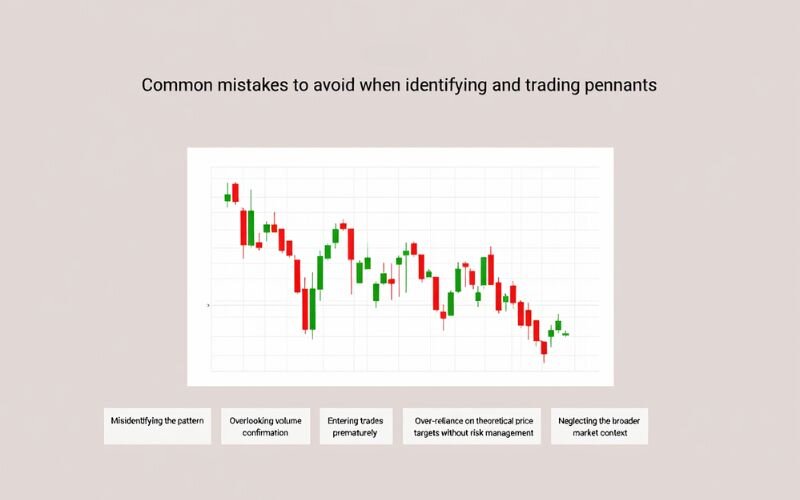
Successfully utilizing pennant patterns requires not only understanding their characteristics but also being aware of common pitfalls. Avoiding these frequent errors can significantly improve a trader's ability to interpret and act on these formations effectively. Here are some prevalent mistakes and how to address them:
1. Misidentifying the pattern.
- Issue: Confusing pennants with other similar formations like flags or larger triangles due to an insufficient grasp of their defining features.
- Potential consequence: Incorrect trade expectations and strategies based on the wrong pattern.
- Lesson/Remedy: Thoroughly learn the specific criteria for a pennant – a clear flagpole followed by small, converging trendlines and a short duration. Review examples to solidify understanding.
2. Ignoring or misjudging the flagpole.
- Issue: Failing to recognize the necessity of a strong, sharp flagpole preceding the consolidation, or underestimating its significance in setting the trend direction.
- Potential consequence: Interpreting a simple consolidation as a pennant, leading to weak or invalid signals.
- Lesson/Remedy: Always confirm the presence of a dynamic flagpole as the initial component of the pattern. Without it, it's not a true pennant.
3. Overlooking volume confirmation.
- Issue: Not paying attention to trading volume patterns – specifically, the decrease in volume during pennant formation and the crucial surge on breakout.
- Potential consequence: Acting on breakouts that lack volume support, which are more prone to failure.
- Lesson/Remedy: Volume is a key validator. Always look for diminishing volume during consolidation and a significant increase as price breaks out.
4. Entering trades prematurely.
- Issue: Placing orders before a clear, confirmed breakout from the pennant's trendlines.
- Potential consequence: Being caught in false breakouts or continued consolidation, leading to unnecessary losses or frustrating trades.
- Lesson/Remedy: Exercise patience. Wait for a decisive candle to close outside the pattern, ideally accompanied by increased volume, before considering entry.
5. Over-reliance on theoretical price targets without risk management.
- Issue: Treating the projected price target (based on flagpole height) as a guarantee and failing to implement proper risk management measures like stop-loss orders.
- Potential consequence: Significant losses if the market moves against the expected direction or fails to reach the target.
- Lesson/Remedy: Targets are estimates, not certainties. Always define your risk per trade and use stop-loss orders to protect capital. Adjust targets based on evolving market conditions.
6. Neglecting the broader market context.
- Issue: Focusing solely on the pennant pattern without considering overarching market trends, significant news events, or support/resistance levels from higher timeframes.
- Potential consequence: Trading against a stronger, larger-degree trend or being surprised by market-moving events.
- Lesson/Remedy: Always analyze pennants within the context of the bigger picture. Ensure the pattern aligns with, or at least isn't directly opposed by, more dominant market forces.
9. Pennant patterns across different financial markets
One of the compelling aspects of chart patterns like the pennant is their universal applicability across various financial markets. The underlying principles of market psychology and price action that create these formations tend to manifest regardless of the specific asset being traded.
- Forex pennant pattern: Pennants are frequently observed in the foreign exchange market. The high liquidity and often strong trending nature of currency pairs provide ample opportunities for the sharp flagpoles and subsequent consolidations characteristic of pennants to form.
- Stock pennant pattern: These patterns are also common on stock price charts. Individual stocks, especially those experiencing strong momentum or reacting to news, can exhibit the clear flagpole and pennant structures.
- Crypto pennant pattern: With the rise of digital assets, the crypto pennant pattern has become increasingly recognized and utilized by cryptocurrency traders. The notable volatility in crypto markets often leads to the sharp price movements necessary to create flagpoles, followed by periods of consolidation that can form pennants.
While the fundamental structure and interpretation of pennants remain consistent, it's worth noting that market-specific characteristics can influence their appearance and nuances. Factors such as typical volatility levels, liquidity, and trading hours specific to Forex, stocks, or crypto might slightly affect how pennants form and their perceived reliability. Traders should always consider these contextual market factors.
10. FAQ about Pennant Pattern
Q1: How long does a pennant pattern typically last?
A: Pennants are short-term patterns, usually forming over 1 to 3 weeks. If it extends much longer, it might be evolving into a different pattern, such as a symmetrical triangle, and its implications might change.
Q2: Is a pennant pattern always a continuation pattern?
A: Predominantly, yes. Pennants are considered strong continuation signals in the direction of the initial flagpole. However, like all chart patterns, false signals (failed breakouts) can occur, especially in volatile market conditions. This is why confirmation through volume and other indicators is crucial.
Q3: What is the most important factor in confirming a pennant breakout?
A: A significant increase in trading volume accompanying the price breakout is a crucial confirmation factor. A breakout on low volume is less reliable and more prone to failure. Strong volume suggests greater conviction and participation behind the move.
Q4: Can I trade based solely on a pennant pattern?
A: While pennants can be powerful, it's not advisable to trade based solely on any single pattern. For more robust decision-making, always use pennants in conjunction with other technical indicators (like moving averages, RSI, MACD), overall market context, and sound risk management principles.
Q5: What does pennant mean?
A: A pennant is a short-term continuation chart pattern that signals a temporary pause in a strong existing trend. It typically forms after a sharp price movement (the flagpole) and indicates the market is consolidating before potentially resuming its prior direction.
Q6: Is a pennant bullish or bearish?
A: It can be both, depending on the preceding trend. A bullish pennant follows an uptrend and signals a likely continuation upwards, while a bearish pennant follows a downtrend and signals a likely continuation downwards.
Q7: What is the difference between a flag and a pennant?
A: Both are continuation patterns featuring a flagpole. The primary difference is the shape of the consolidation phase: a pennant has two converging trendlines (forming a small triangle), while a flag has two parallel trendlines (forming a small, often rectangular or channel-like shape).
Q8: How reliable is the pennant pattern?
A: While often effective, no chart pattern boasts 100% reliability. The pennant pattern reliability is enhanced by clear formation, strong volume confirmation during breakout, and alignment with the broader market context. It should always be used alongside other analytical tools and sound risk management, as false breakouts can occur.
11. Conclusion
Clearly understanding what is a pennant and how it forms represents a significant step forward in your journey to mastering technical analysis. This pattern, whether bullish or bearish, provides valuable insights into the potential continuation of a trend, helping you make more informed assessments of the market. However, always remember that no pattern is absolute. Combining its signals with other analytical tools, alongside rigorous risk management, remains the cornerstone of trading responsibly.
Don't forget to follow H2T Finance to discover more useful foundational knowledge! Got questions about pennants? Ask in the comments below! Explore more chart patterns in our Forex Basics section.