Are you just starting your forex trading journey and frequently hearing the term "price action," but still not entirely sure what is price action and why it's so crucial? Simply put, price action is the "language" of the market, reflecting the psychology and behavior of all participants.
Mastering how to read price action will give you a significant edge in analyzing charts and making more informed trading decisions, even without relying on complex technical indicators. Let's dive deeper into this fundamental concept with H2T Finance!
1. What is price action trading
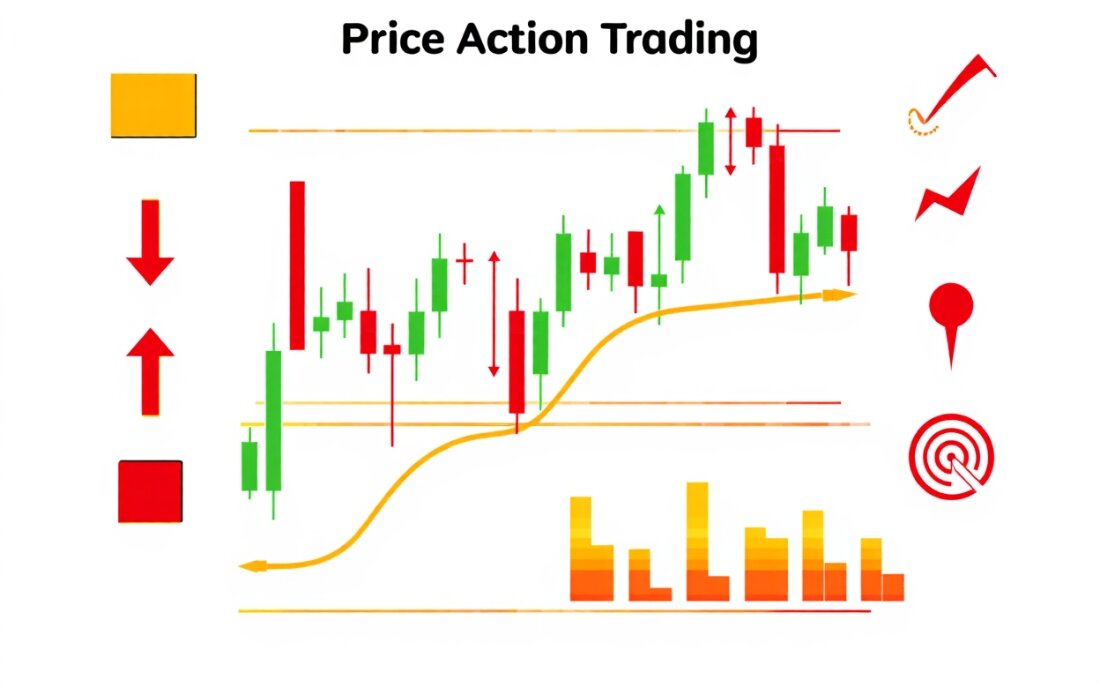
To begin, it's essential to understand what price action is. In its simplest terms, price action is the movement of an asset's price when charted over time.
This movement, visualized through various chart types like candlestick, bar, or line charts, forms a direct picture of the ongoing battle between supply (sellers) and demand (buyers) within a specific market. It essentially captures the market's footprint, revealing where collective buying and selling pressures have dictated price direction.
The true nature of price action lies in its characteristic as the 'raw' or 'naked' data of price movements, completely unfiltered by the calculations or interpretations of technical indicators. While indicators derive their values from price data, price action is the original source material itself.
This raw data is what makes the importance of price action so profound: it serves as the fundamental building block for nearly all forms of technical analysis.
By learning to meticulously observe and interpret price action, traders aim to decipher the "story" that the market is currently narrating, gaining insights into potential future movements. Consequently, a solid grasp of price action is an indispensable component of mastering technical analysis basics, providing the essential context required before layering on other analytical tools.
2. What is an example of a price action?
Price action is, at its core, the study of historical price movements to anticipate future direction. Instead of relying heavily on mathematical indicators derived from price (like moving averages or RSI), a price action trader focuses on the raw price data itself, often visualized through candlestick charts. An example helps illustrate this practical approach.
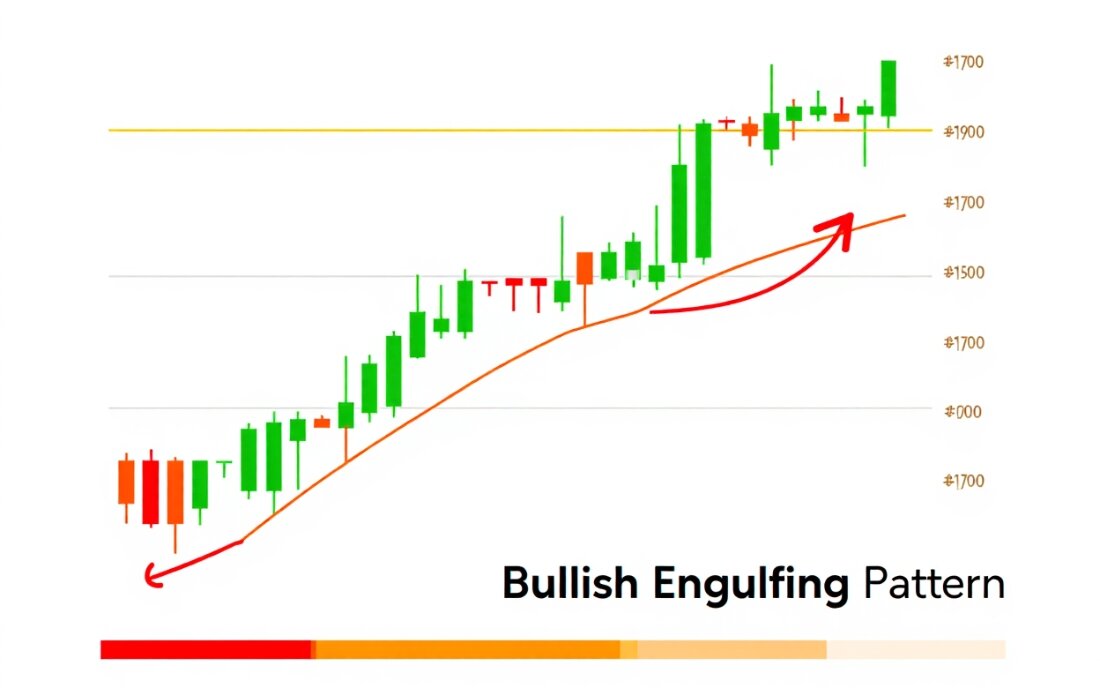
Let's consider a common scenario: identifying a Bullish Engulfing pattern on a Forex currency pair chart, such as EUR/USD.
- The Context: Imagine the EUR/USD has been in a short-term downtrend or a period of consolidation, with several bearish (selling) candles or small, indecisive candles appearing.
- The Pattern Formation:
- You observe a relatively small bearish (red or black) candlestick, indicating that sellers were in control during that period, pushing the price down from its open.
- The very next candlestick is a large bullish (green or white) one. Crucially, the body of this bullish candle completely "engulfs" the entire body of the previous bearish candle. This means the bullish candle opens lower than or at the previous candle's close and closes higher than the previous candle's open.
- Interpreting the Price Action:
To a price action trader, this sequence (the bullish engulfing pattern) signals a potential and significant shift in market sentiment.- The small bearish candle showed existing selling pressure or indecision.
- The subsequent large bullish candle that "engulfs" the prior one demonstrates that buyers have stepped in with significant force and conviction during that period, overpowering the sellers at those price levels.
- It suggests that the preceding selling pressure is waning or has been absorbed, and buying momentum is now increasing. The bulls have taken control from the bears, at least for that period.
- Potential Trader Response (based purely on this price action):
A price action trader might interpret this as a potential bottoming formation or the start of a new upward move.- They might consider looking for an opportunity to enter a long (buy) position, perhaps on the open of the next candle or after a slight pullback towards the engulfing candle's range.
- A stop-loss order would typically be placed below the low of the bullish engulfing candle to manage risk if the interpretation proves incorrect.
- The profit target could be based on previous resistance levels or a measured move based on the pattern's height.
This entire analysis - observing the candlestick shapes, their relative sizes, their sequence, their position within a broader trend (or lack thereof), and the implied struggle between buyers and sellers - is an example of interpreting price action.
The trader isn't primarily relying on an external indicator to generate a signal; they are reading the "story" that the price movements themselves are telling directly on the chart. Other examples could include identifying pin bars (hammers/shooting stars) at key support/resistance levels, breakouts from consolidation patterns like triangles or ranges, or the formation of higher highs and higher lows in an uptrend.
See more related articles:
- 10+ Legal Forex trading app in India: Guide to safe and compliant trading
- How to get money from forex? A 7-step guide you need in 2025
- Does Blusky allow scalping? Explore the trading methods available at Blusky for investors
3. Why is price action crucial for traders, especially in Forex?
The importance of price action cannot be overstated for traders, and its relevance is particularly amplified in the dynamic world of forex. Several key attributes contribute to its crucial role in a trader's analytical toolkit. Firstly, price action provides market information in real-time, without the inherent lag often associated with many technical indicators, which derive their data from past prices. This immediacy is vital.
Secondly, price action exhibits remarkable flexibility; its principles can be applied across virtually any financial market, including stocks, commodities, and very effectively in analyzing forex price action. Moreover, it is adaptable to all trading timeframes, from short-term scalping charts to long-term investment horizons. This universality makes it an indispensable skill. Price action also simplifies the decision-making process. By encouraging traders to focus on the core element – price itself – it helps to cut through the noise of potentially conflicting signals from multiple indicators, leading to clearer analysis.
Furthermore, price movements often offer direct clues about prevailing market sentiment, reflecting the collective emotions of fear, greed, and indecision among participants. These psychological footprints are embedded in the patterns and formations on a price chart. As such, it forms the basis for a multitude of trading strategies (often referred to as a price action strategy), guiding everything from identifying the overall market trend to pinpointing precise entry and exit points for trades.

Especially in the highly liquid and often rapidly fluctuating forex market, understanding price action is paramount for timely reactions. The speed at which currency prices can change means traders need to interpret market signals quickly and accurately. For instance, during major news releases like the Non-Farm Payrolls (NFP) or FOMC statements, price action vividly displays market reactions. You might see sharp, decisive candlestick movements indicating a clear new direction, or conversely, long wicks and small bodies showing significant indecision and struggle between buyers and sellers.
To illustrate further, consider a scenario where a currency pair has been in a sustained uptrend and approaches a known, significant resistance level. If a prominent bearish pin bar candlestick forms at this resistance, this is a powerful price action signal. It suggests that despite the prior buying pressure, sellers have stepped in forcefully at that level, potentially indicating an imminent reversal or a significant pullback.
Visually, imagine the price is nearing an old high where it has reversed multiple times in the past. If you then observe a cluster of small-bodied candles forming, each with long upper wicks, this price action is 'speaking' to you. It's a visual cue of repeated price rejection, strongly suggesting that selling pressure at that specific zone is substantial and buyers are struggling to push prices higher. These real-time observations are invaluable.
4. The core components: How to read price action effectively
To truly learn how to read price action effectively, it's essential to understand its fundamental building blocks. Just like learning a language involves understanding letters and words before constructing sentences, reading price action requires familiarity with its core components. These elements, when combined, paint a comprehensive picture of market dynamics.
4.1. Candlestick patterns: The language of the market
One of the most direct ways to interpret market sentiment is through candlestick patterns. Originating from Japan, candlesticks are the primary units for visually representing price movements on a chart for many price action traders. Each candlestick encapsulates four key pieces of price data for a specific period: the open price (where the price started at the beginning of the period), the close price (where the price ended), the high price (the highest point reached), and the low price (the lowest point reached).
The main part of the candlestick is called the real body, which represents the range between the open and close prices. If the close is above the open, the body is often colored green or white (bullish candle, indicating buying pressure). If the close is below the open, it's typically red or black (bearish candle, indicating selling pressure). The thin lines extending above and below the real body are known as wicks or shadows (or tails), indicating the high and low prices reached during the period beyond the open and close.
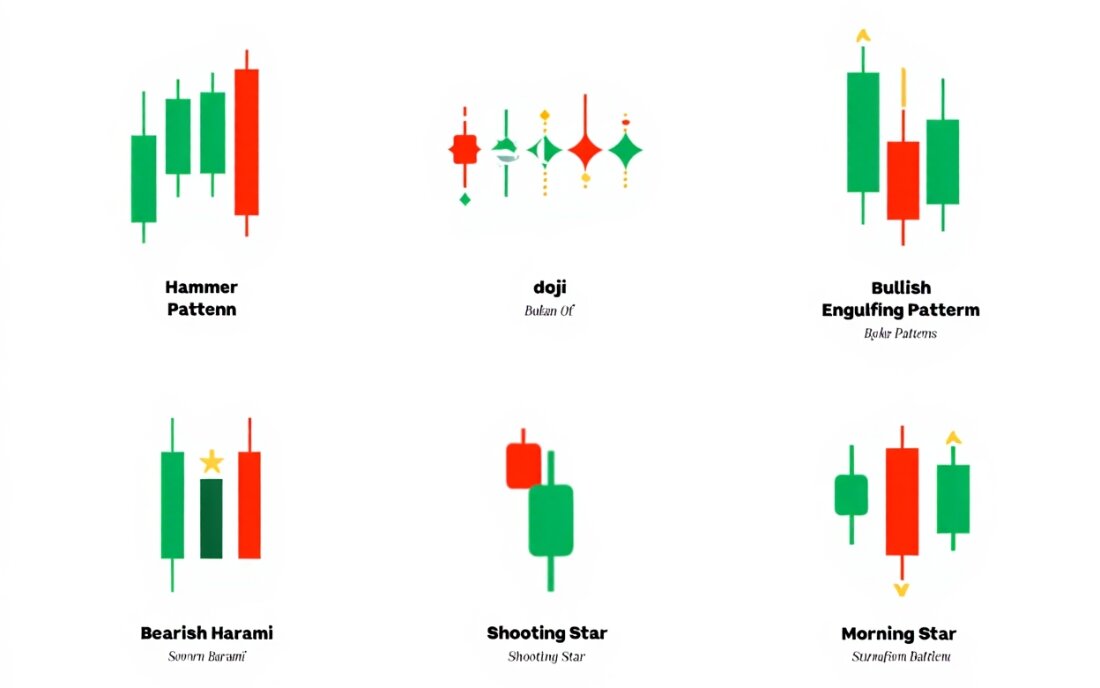
While there are numerous candlestick patterns, a few simple yet common ones offer valuable insights for beginners:
-
Doji: Characterized by a very small or non-existent real body, where the open and close prices are virtually the same. A Doji signifies indecision in the market, as neither buyers nor sellers could gain control. Its appearance after a strong trend can sometimes signal a potential turning point.
-
Hammer and Hanging Man: These look identical but differ based on the preceding price action. They have a small real body near the top of the trading range and a long lower wick (at least twice the size of the body), with little to no upper wick.
-
A Hammer appearing after a downtrend can indicate potential bullish reversal, as sellers pushed prices down, but buyers stepped in to drive them back up near the open.
-
A Hanging Man appearing after an uptrend can signal a potential bearish reversal, suggesting that while buyers tried to maintain the uptrend, selling pressure emerged.
-
-
Engulfing Pattern (Bullish or Bearish): This is a two-candle pattern.
-
A Bullish Engulfing occurs when a smaller bearish candle is followed by a larger bullish candle whose body completely "engulfs" the body of the previous bearish candle. It suggests a strong shift towards buying momentum.
-
A Bearish Engulfing occurs when a smaller bullish candle is followed by a larger bearish candle whose body completely engulfs the body of the previous bullish candle. It indicates a strong shift towards selling momentum.
-
Understanding these basic candlestick patterns is crucial because candlesticks are the fundamental units for reading price action. They provide a visual snapshot of the buying and selling pressure within a specific timeframe, offering clues to potential future price movements. (H2T Finance offers more detailed guides on specific candlestick patterns if you wish to delve deeper).
4.2. Market structure: Identifying trends and ranges
Beyond individual candlesticks, understanding the broader market structure is crucial for effective price action analysis. Market structure refers to the way price movements form patterns of highs and lows over time, which helps traders identify the overall directional bias of the market. This forms a key part of trend analysis.
There are three primary market structures to recognize:
-
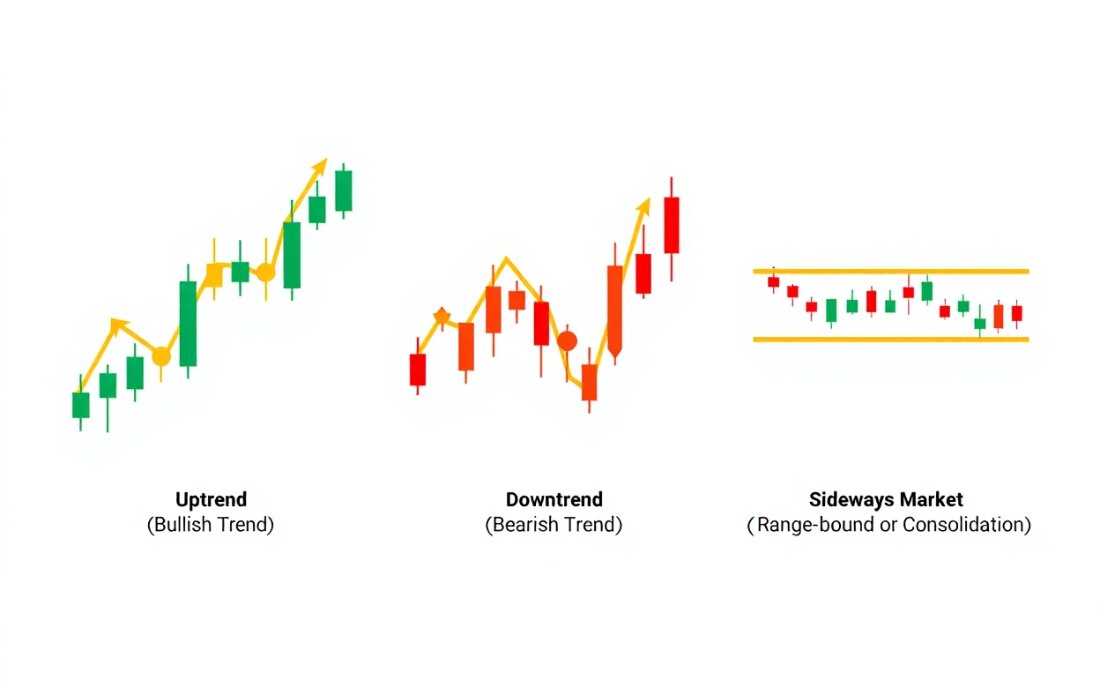
Uptrend (Bullish Trend):
An uptrend is characterized by a series of higher swing highs (HH) and higher swing lows (HL). This means each new peak in price is higher than the previous peak, and each new trough (pullback) is higher than the previous trough. Identifying an uptrend suggests that buyers are in control, and the general path of least resistance for price is upwards. On a chart, you would visually connect the rising lows with a trend line.
(Suggested image: A chart segment clearly showing an uptrend with HHs and HLs labeled, and an upward sloping trend line connecting the HLs.)
-
Downtrend (Bearish Trend):
Conversely, a downtrend is defined by a series of lower swing highs (LH) and lower swing lows (LL). In this scenario, each successive peak is lower than the one before it, and each trough is also lower than its predecessor. A downtrend indicates that sellers are dominant, and prices are generally expected to continue falling. A downward sloping trend line can be drawn connecting the LHs.
(Suggested image: A chart segment clearly showing a downtrend with LHs and LLs labeled, and a downward sloping trend line connecting the LHs.)
-
Sideways Market (Range-bound or Consolidation):
A sideways market occurs when the price oscillates between a relatively defined upper boundary (resistance) and lower boundary (support), without making significant progress in either direction. In this state, there are no clear higher highs and higher lows (for an uptrend) or lower highs and lower lows (for a downtrend). It signifies a period of equilibrium or indecision where buyers and sellers are relatively balanced. Trading within a range or waiting for a breakout are common approaches here.
The importance of correctly identifying the current market structure cannot be overstated. It provides the context for trading decisions. For example, in an uptrend, traders might look for buying opportunities during pullbacks. In a downtrend, they might seek selling opportunities during rallies. Attempting to trade against a strong prevailing trend without clear reversal signals is generally riskier. Understanding market structure helps align your trades with the dominant market flow.
4.3. Support and resistance levels: Key turning points
Another vital component in learning how to read price action involves identifying support and resistance levels. These are specific price areas on a chart where the price has historically shown a tendency to stall or reverse. They represent psychological barriers where the balance between buyers and sellers can shift.
-
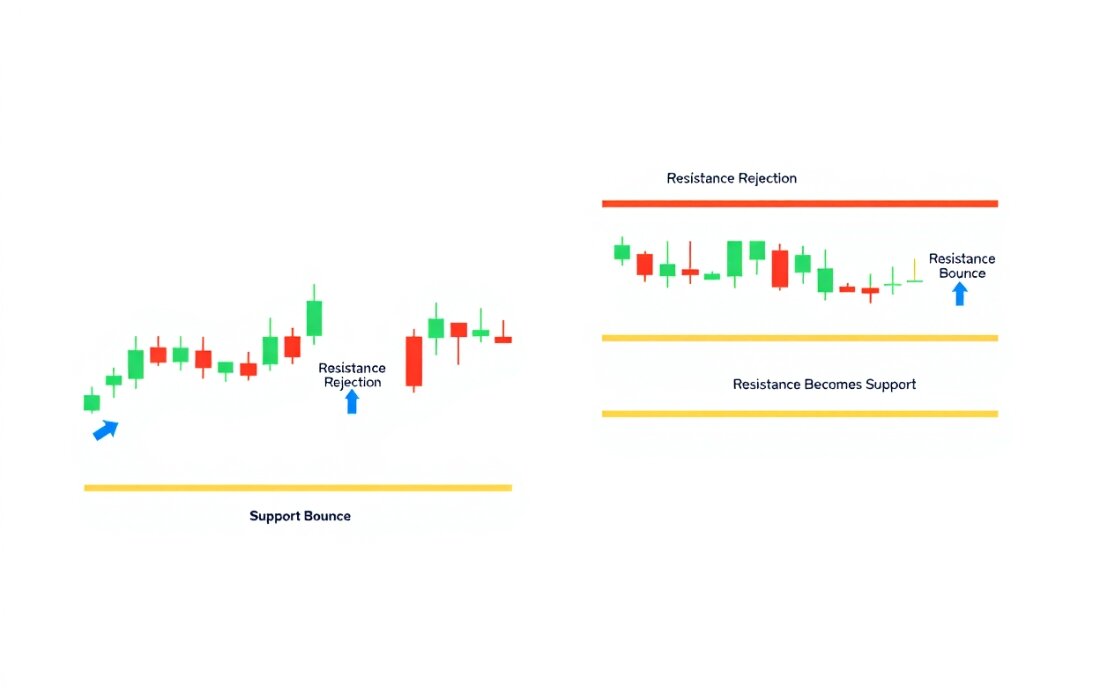
Support: Support is a price level or zone below the current market price where buying interest is anticipated to be strong enough to overcome selling pressure, thereby halting a price decline and potentially causing it to reverse upwards. Think of it as a floor. When prices approach a support level, it's an area where buyers who missed earlier opportunities, or those who believe the asset is now undervalued, may step in. Previously broken resistance levels can often become new support levels.
-
Resistance: Resistance is a price level or zone above the current market price where selling interest is expected to be sufficiently strong to overcome buying pressure, thus stopping a price advance and potentially causing it to turn downwards. Consider it a ceiling. As prices near a resistance level, sellers who took profits earlier might look to re-enter short positions, or buyers might decide to take profits, increasing the supply. Previously broken support levels can frequently turn into new resistance levels (a concept known as "role reversal").
How to identify basic support and resistance levels? A common way for beginners to spot these levels is by looking for:
- Previous swing highs and swing lows: Significant past peaks (highs) often act as resistance, while significant past troughs (lows) can act as support. The more times the price has respected a certain level, the stronger that level is considered.
- Areas of frequent price rejection: Zones where the price has visibly struggled to break through multiple times, even if not exact to the pip, can denote strong support or resistance. These are often seen as "clusters" of price activity.
The role of support and resistance in trading is multifaceted. These levels are crucial for:
- Identifying potential entry points: Traders might look to buy near support in an uptrend or sell near resistance in a downtrend.
- Setting stop-loss orders: Placing a stop-loss just beyond a support level (for a long trade) or a resistance level (for a short trade) is a common risk management technique.
- Determining profit targets: Traders might aim to take profits as the price approaches a significant opposing support or resistance level.
Understanding where these potential turning points lie is fundamental to navigating price charts and making informed trading decisions based on price action.
4.4. Basic price action patterns: Signals of continuation or reversal
Beyond individual candlesticks and broad market structure, price action patterns emerge when multiple candlesticks combine with market structure elements like support, resistance, and trendlines. These recognizable formations can provide traders with clues about whether a market is likely to continue its current trend or reverse course. For beginners, understanding a few basic patterns can be a good starting point.
While the detailed exploration of each pattern is beyond this introductory scope, here are a couple of fundamental examples:
-
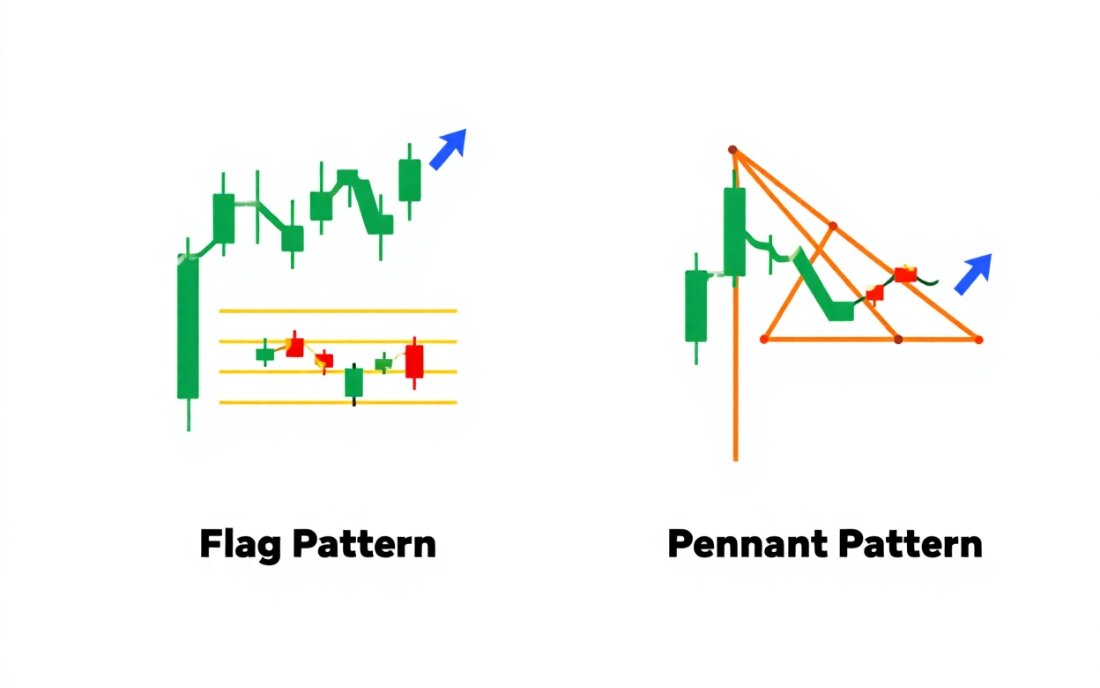
Flags and Pennants (Continuation Patterns):
Flags typically appear after a strong, sharp price movement (the "flagpole"). They are characterized by a rectangular consolidation period where price trades in a narrow range, often sloping slightly against the preceding trend, before breaking out in the direction of the initial strong move. A flag suggests a brief pause before the trend resumes.
Pennants are similar to flags, but the consolidation phase takes on a small, symmetrical triangle shape (like a pennant on a pole). They also form after a strong move and usually indicate a continuation of that prior trend once price breaks out of the pennant formation.
-
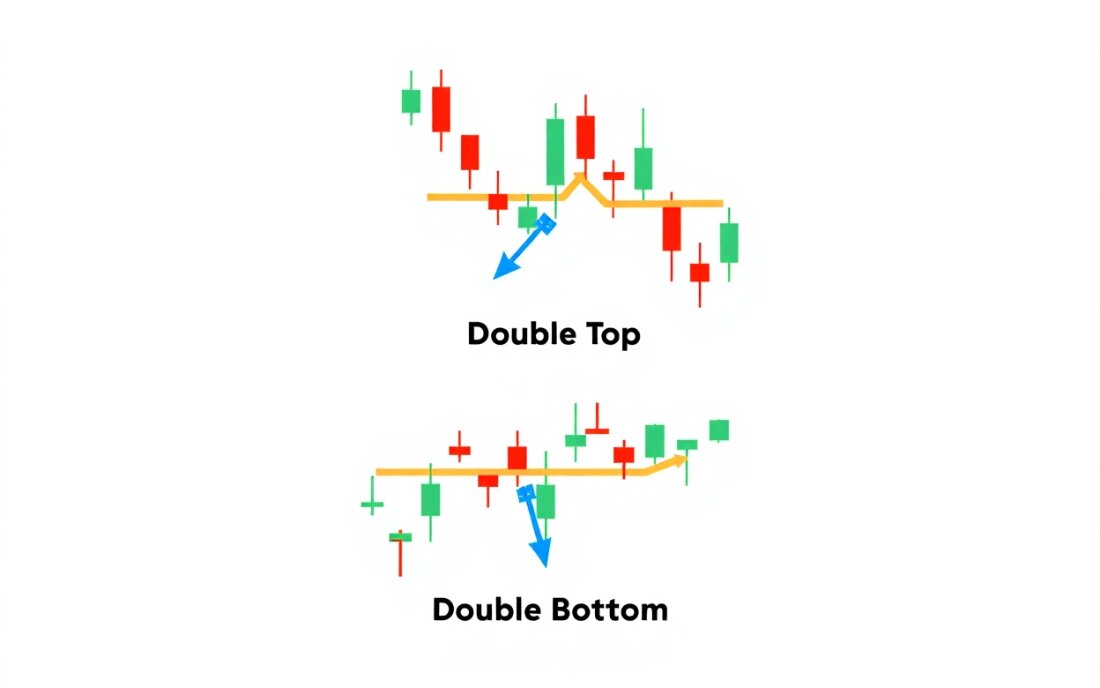
Double Top and Double Bottom (Reversal Patterns):
A Double Top is a bearish reversal pattern that forms after an extended uptrend. It occurs when price reaches a high, retraces, rallies back to a similar high (creating two distinct peaks at roughly the same level), and then fails to break above it, subsequently declining below the intervening trough (the "neckline"). This pattern signals that buying momentum is waning and sellers may be taking control.
A Double Bottom is a bullish reversal pattern that appears after an extended downtrend. It's characterized by price hitting a low, rallying, declining back to a similar low (forming two distinct troughs), and then failing to break lower, eventually breaking above the intervening peak (the "neckline"). This suggests selling pressure is exhausting, and buyers are stepping in.
The purpose of introducing these basic price action patterns here is to illustrate how individual candlesticks and broader market structures like support and resistance converge to create larger, more significant trading signals. These patterns are not foolproof, but they provide a framework for interpreting potential market intentions. Recognizing them requires practice and an eye for how price behaves around key levels. Remember, the context in which a pattern appears (e.g., during a strong trend or at a major support/resistance zone) is crucial for its interpretation.
5. Price action trading: An overview of strategies
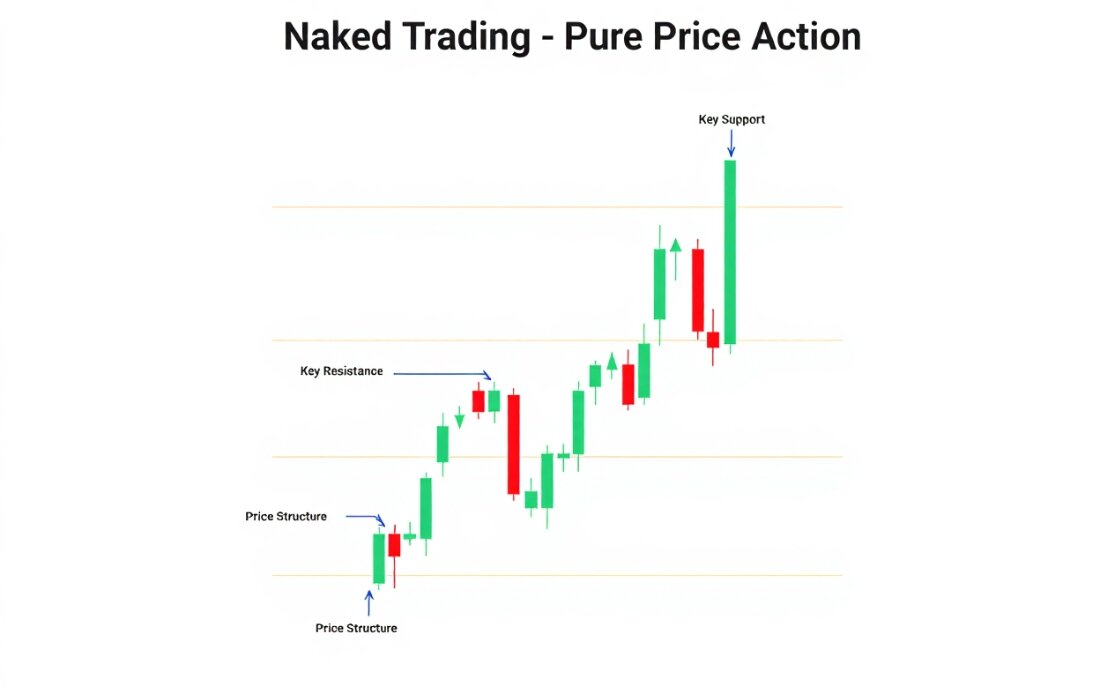
Having explored the core components of price action, we can now turn to price action trading. At its heart, price action trading is a methodology where trading decisions, such as entries, exits, and trade management, are based primarily, or even entirely, on the analysis of an asset's raw price movement as depicted on a "naked" or clean chart. This approach prioritizes the direct observation of price behavior over reliance on secondary, derived technical indicators.
5.1. The concept of "naked trading"
A term often used synonymously with, or as a core aspect of, price action trading is "naked trading." This simply refers to trading without the use of technical indicators, or with very minimal use of them. Instead of populating charts with oscillators, moving averages, or other mathematical derivations of price, naked traders focus intently on the price bars or candlesticks themselves, along with structural elements like trend lines, support and resistance levels, and chart patterns.
The primary advantages of naked trading are:
- Reduced "analysis paralysis": By minimizing or eliminating indicators, traders can avoid the confusion and conflicting signals that often arise from using too many tools.
- Focus on direct market signals: Price itself is the most current and direct reflection of market sentiment and order flow. Naked trading hones the skill of reading these primary signals.
- Cleaner charts: A less cluttered chart can lead to clearer interpretation and quicker decision-making.
However, naked trading also presents challenges:
- Requires significant skill and experience: Accurately interpreting raw price action demands a well-trained eye and a deep understanding of market dynamics. It's less "mechanical" than indicator-based systems.
- Can be more subjective: Without the objective buy/sell signals some indicators provide, the interpretation of price action can vary more between traders.
5.2. Common approaches in price action strategies
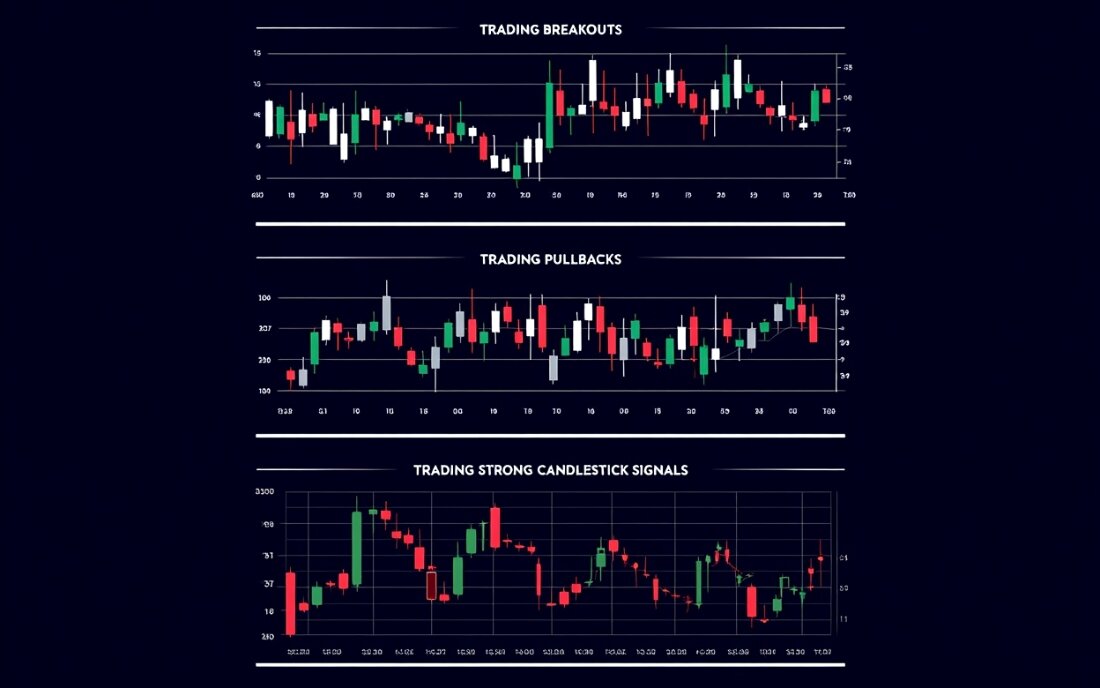
While individual expressions of a price action strategy can be diverse, several common approaches form the bedrock of many methodologies. These strategies generally revolve around identifying high-probability setups based on how price interacts with key levels and patterns:
- Trading breakouts:
This involves identifying a significant support or resistance level, or a well-defined chart pattern (like a flag, pennant, or triangle), and entering a trade when price decisively breaks through that level or pattern boundary. The expectation is that the momentum of the breakout will carry the price further in the breakout direction.
- Trading pullbacks (or retracements):
In an established trend (uptrend or downtrend), prices rarely move in a straight line. They often "pull back" or retrace temporarily against the prevailing trend before resuming. Price action traders look for these pullbacks to key areas, such as a previously broken resistance-turned-support level, a support level in an uptrend, a resistance level in a downtrend, or a significant trend line. They then seek price action signals (like specific candlestick patterns) at these levels to enter in the direction of the overall trend.
- Trading strong candlestick signals at key zones:
This approach focuses on identifying powerful, individual candlestick patterns (like pin bars, engulfing patterns, or Dojis at the end of a move) that form at critical price junctures. These key zones include major support and resistance levels, pivot points, or confluence areas where multiple analytical elements converge. A strong candle signal in such a location can be the trigger for a trade.
It's important to emphasize that these are just broad conceptual approaches. A complete price action strategy will also incorporate specific rules for entry, stop-loss placement, profit targets, and overall risk management. Furthermore, the beauty of price action trading lies in its adaptability; strategies are often tailored to a trader's individual style, preferred market, timeframe, and risk tolerance.
See more related articles: What is Forex Trading?
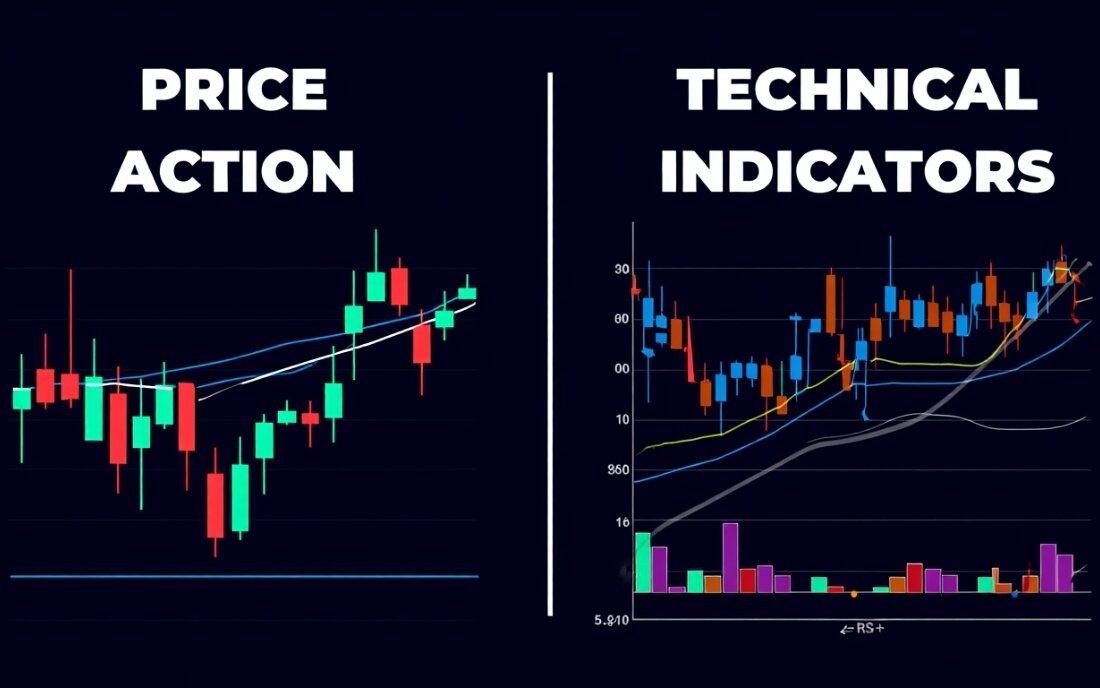
6. Price action vs. technical indicators
A common point of discussion, especially for those new to trading, revolves around the distinction between relying on raw price action vs indicators derived from price. Understanding their fundamental differences is key to developing a coherent analytical approach.
Price Action:
- Source of Information: Price action is the original, unfiltered data directly from the market. It represents the actual transaction prices as they occur.
- Signal Timing: It is generally considered to provide earlier, or 'leading,' insights into potential market shifts. Because it's a direct reflection of buying and selling pressure, changes in sentiment can often be spotted first in price behavior.
- Interpretation: Analyzing price action often requires a greater degree of subjective interpretation and pattern recognition skills. What one trader sees as a significant signal, another might interpret differently based on experience and context.
Technical Indicators:
- Source of Information: Technical indicators are mathematical calculations based on historical price data, volume, or sometimes open interest. Examples include Moving Averages, RSI (Relative Strength Index), MACD (Moving Average Convergence Divergence), and Stochastic Oscillators.
- Signal Timing: Most technical indicators are inherently 'lagging,' meaning they confirm moves that have already begun to happen. This is because they need sufficient past price data to generate their readings. Some indicators are designed to be more predictive, but they still rely on past data. Their primary role is often to smooth out price data or highlight specific conditions like overbought/oversold levels.
- Interpretation: Indicators often provide more objective signals. For instance, an RSI reading above 70 is generally accepted as an "overbought" condition, offering a clear, quantifiable value.
The relationship between Price Action and Indicators:
It's crucial to understand that price action and technical indicators are not necessarily mutually exclusive. Many successful traders find ways to combine them effectively. Price action can provide the overall market context and initial clues, while indicators can be used for confirmation or to filter out lower-probability setups. For example, a trader might spot a bullish engulfing pattern (price action) at a key support level and then look for a moving average to start angling upwards or an oscillator to show bullish divergence (indicator confirmation).
However, for traders just starting out, it's often recommended to learn price action first. Understanding the fundamental language of the market—how price moves, forms trends, and reacts at key levels—provides a solid foundation before adding layers of indicators, which can sometimes obscure direct price signals if not properly understood.
So, can you trade with price action alone? Yes, absolutely. Many consistently profitable traders, often referred to as "purists" or "naked traders," rely solely on price action analysis. This approach, however, typically requires significant screen time, diligent practice, and well-honed chart-reading skills.
To summarize the key differences in a price action vs indicators comparison:
| Feature | Price Action | Technical Indicators |
| Data Source | Raw, direct market price | Processed (mathematical calculations of price/volume) |
| Signal Timing | Generally leading | Mostly lagging (confirmatory) |
| Interpretation | More subjective, skill-based pattern recognition | More objective, rule-based signals |
| Primary Purpose | Provides market context & direct, early signals | Confirms signals, smooths price, and identifies conditions |
| Best Suited For | Traders preferring simplicity & early signals | Traders seeking confirmation & more objective criteria |
Ultimately, the choice of whether to use price action alone, indicators alone, or a combination depends on the individual trader's personality, style, and what they find works best for them through practice and experience.
7. Tips for beginners to learning and mastering price action
Embarking on the journey to learn price action and eventually master it is a rewarding endeavor for any trader. While it might seem daunting at first, a structured approach and consistent effort can lead to proficiency. Here are some practical tips specifically tailored for beginners looking to understand price action basics:
-
Start with the fundamentals:
Before diving into complex strategies, ensure you have a solid grasp of the absolute basics. This includes thoroughly understanding candlestick construction (open, high, low, close, body, wicks), how to identify the prevailing market trend (uptrends, downtrends, ranges), and how to draw and interpret simple support and resistance levels. These are the foundational pillars.
-
Dedicated chart study:
There's no substitute for screen time. Spend considerable time meticulously observing real-time and historical price charts. Watch how price moves, how candlestick patterns form in different market conditions, and how price reacts when it approaches significant levels or forms recognizable patterns. This active observation builds pattern recognition skills.
-
Practice on a demo account:
Once you've learned some basic concepts, apply your knowledge in a risk-free environment using a demo trading account. This allows you to test your analysis, practice identifying setups, and get a feel for executing trades based on price action signals without risking real capital. Treat your demo trading seriously to build good habits.
-
Cultivate patience and discipline:
Mastering price action is not an overnight achievement; it requires significant time, persistent effort, and unwavering discipline. There will be a learning curve, and not every trade based on price action will be a winner. Stick to your trading plan and analysis rules.
-
Learn from credible sources:
Seek out reliable educational materials. Reputable financial education providers, like H2T Finance, and established trading books or courses can offer structured learning paths and insights from experienced traders. Be wary of "get rich quick" schemes promising guaranteed profits.
-
Maintain a trading journal:
This is an invaluable tool for learning. Systematically record your price action analyses, trade setups, entry/exit points, and the outcomes. Regularly review your journal to identify what worked, what didn't, and areas for improvement. This self-reflection accelerates learning.
-
Focus and don't rush:
Avoid the temptation to learn every price action pattern and concept simultaneously. Start by focusing on mastering a few core concepts or patterns thoroughly before gradually expanding your knowledge base. Trying to absorb too much too quickly can lead to confusion and overwhelm.
By consistently applying these tips, beginners can build a strong foundation in price action analysis, paving the way for more confident and informed trading decisions.
8. Limitations and considerations when using price action
While a powerful approach, it's wise to be aware of certain limitations and considerations when using price action:
- Subjective interpretation: The way price action patterns and signals are read can vary between traders, requiring experience and consistent rules to mitigate ambiguity.
- Potential for false signals (whipsaws): Not all apparent signals will lead to the expected price movement. Markets can produce misleading patterns, especially during high volatility or in choppy, trendless conditions.
- Context is crucial: An individual candlestick or minor pattern may have little meaning in isolation. Its significance increases dramatically when analyzed within the broader market structure (trend, key support/resistance levels).
- Reliability is conditional, not absolute:
- So, is price action reliable? It can be very reliable when applied correctly, with a strong understanding of market context and disciplined execution.
- However, it is not a "holy grail" and does not guarantee profits on every trade.
- Risk management is non-negotiable: Due to the inherent uncertainties, implementing robust risk management practices (like stop-losses and appropriate position sizing) is absolutely essential when trading price action.
9. FAQ about price action
Here are answers to some common questions about price action:
Q1: What is price action in simple terms?
A: In simple terms, price action is the movement of an asset's price over time, as visualized on a chart. It's the 'footprint' of the market, showing the direct result of supply and demand dynamics without the filter of indicators.
Q2: How does price action work to provide trading signals?
A: Price action provides trading signals by forming recognizable patterns and behaviors that often indicate potential shifts in market sentiment or continuations of existing trends. Traders analyze candlestick formations, chart patterns (like flags or double tops), and how price interacts with support and resistance levels to identify these signals. For example, a strong rejection candle at a key resistance level can signal a potential move lower.
Q3: Can I use price action trading without any indicators?
A: Yes, you absolutely can. This approach is often called "naked trading." Many successful traders rely solely on interpreting raw price movements, chart patterns, and support/resistance levels to make their trading decisions. However, it requires skill and experience.
Q4: What are the main components to look for when analyzing price action?
A: The main components include:
- Candlestick patterns: Individual candle shapes that signal sentiment (e.g., Doji, Engulfing, Pin Bar).
- Market structure: Identifying trends (uptrends, downtrends) or ranges by observing patterns of highs and lows.
- Support and resistance levels: Key price zones where buying or selling pressure has historically emerged.
- Broader price action patterns: Combinations of candlesticks and structure that form larger signals (e.g., head and shoulders, triangles).
Q5: Is price action more reliable than technical indicators?
A: Neither is inherently "more" reliable in all situations; they serve different purposes. Price action provides direct, often leading, signals from the market, but its interpretation can be subjective. Technical indicators are often lagging but can offer more objective confirmation. Many traders find that understanding price action provides crucial context, whether they use indicators or not. Reliability for both depends on correct application, market context, and risk management.
Q6: What is an example of a price action signal?
A: An example of a price action signal could be a bullish pin bar forming at a significant support level after a downtrend. This candlestick pattern, with its long lower wick, suggests that sellers tried to push the price down, but buyers stepped in strongly to reject lower prices, potentially signaling an upcoming move higher.
Q7: Are price action strategies effective?
A: Yes, price action strategies can be very effective when developed and applied with discipline and robust risk management. Their effectiveness often comes from focusing on direct market behavior and adapting to various market conditions. However, like any trading strategy, they are not foolproof and require consistent learning and practice.
10. Conclusion
Through this article, we hope you now have a clearer understanding of what is price action and why it is an indispensable skill for any trader, from beginners to those with extensive experience. Understanding the "story" that the price chart is telling will provide a solid foundation for you to analyze the Forex market with greater confidence. Remember, mastering price action is a continuous journey of learning and practice.
Ready to learn more? Don't forget to explore other helpful articles in the Forex Basics section of H2T Finance to continue building your foundational knowledge.